

Required information The following are the consolidated statement of earnings and the balance sheet of Home Depot,
Question:
Required information
The following are the consolidated statement of earnings and the balance sheet of Home Depot, Inc and Subsidiaries.
| THE HOME DEPOT, INC. AND SUBSIDIARIES CONSOLIDATED STATEMENTS OF EARNINGS | |||||||||||
| Fiscal Year Ended(1) | |||||||||||
| amounts in millions, except per share data | January 31,2016 | February 1, 2015 | February 2, 2014 | ||||||||
| NET SALES | $ | 66,181 | $ | 71,294 | $ | 77,359 | |||||
| Cost of Sales | 43,756 | 47,283 | 51,349 | ||||||||
| GROSS PROFIT | 22,425 | 24,011 | 26,010 | ||||||||
| Operating Expenses: | |||||||||||
| Selling, General and Administrative | 15,897 | 17,832 | 17,052 | ||||||||
| Depreciation and Amortization | 1,702 | 1,766 | 1,687 | ||||||||
| Total Operating Expenses | 17,599 | 19,598 | 18,739 | ||||||||
| OPERATING INCOME | 4,826 | 4,413 | 7,271 | ||||||||
| Interest and Other (Income) Expense: | |||||||||||
| Interest and Investment Income | (27 | ) | (27 | ) | (79 | ) | |||||
| Interest Expense | 666 | 617 | 690 | ||||||||
| Other | (150 | ) | 150 | — | |||||||
| Interest and Other, net | 789 | 740 | 611 | ||||||||
| EARNINGS BEFORE PROVISION FOR INCOME TAXES | 4,037 | 3,673 | 6,660 | ||||||||
| Provision for Income Taxes | 1,343 | 1,277 | 2,399 | ||||||||
| NET EARNINGS | $ | 2,694 | $ | 2,396 | $ | 4,261 | |||||
| Weighted Average Common Shares | 1,599 | 1,662 | 1,748 | ||||||||
| BASIC EARNINGS PER SHARE | $ | 1.68 | $ | 1.62 | $ | 2.44 | |||||
| Diluted Weighted Average Common Shares | 1,611 | 1,670 | 1,609 | ||||||||
| DILUTED EARNINGS PER SHARE | $ | 1.67 | $ | 1.43 | $ | 2.65 | |||||
(1) Fiscal years ended January 31, 2016, February 1, 2015 and February 2, 2014 include 52 weeks.
| THE HOME DEPOT, INC. AND SUBSIDIARIES CONSOLIDATED BALANCE SHEETS | |||||||
| amounts in millions, except share and per share data | January 31, 2016 | February 1, 2015 | |||||
| ASSETS | |||||||
| Current Assets: | |||||||
| Cash and Cash Equivalents | $ | 1,276 | $ | 1,222 | |||
| Receivables, net | 965 | 988 | |||||
| Merchandise Inventories | 10,278 | 10,688 | |||||
| Other Current Assets | 1,321 | 1,209 | |||||
| Total Current Assets | 13,840 | 14,107 | |||||
| Property and Equipment, at cost | 37,439 | 36,607 | |||||
| Less Accumulated Depreciation and Amortization | 11,725 | 10,183 | |||||
| Net Property and Equipment | 25,714 | 26,424 | |||||
| Goodwill | 1,177 | 1,153 | |||||
| Other Assets | 232 | 408 | |||||
| Total Assets | $ | 40,963 | $ | 42,092 | |||
| LIABILITIES AND STOCKHOLDERS’ EQUITY | |||||||
| Current Liabilities: | |||||||
| Short-Term Debt | $ | 370 | $ | 570 | |||
| Accounts Payable | 5,413 | 4,803 | |||||
| Accrued Salaries and Related Expenses | 1,244 | 1,120 | |||||
| Sales Taxes Payable | 348 | 327 | |||||
| Deferred Revenue | 1,143 | 1,160 | |||||
| Income Taxes Payable | 105 | 271 | |||||
| Current Installments of Long-Term Debt | 1,010 | 1,761 | |||||
| Other Accrued Expenses | 1,573 | 1,633 | |||||
| Total Current Liabilities | 11,206 | 11,645 | |||||
| Long-Term Debt, excluding current installments | 8,654 | 9,655 | |||||
| Other Long-Term Liabilities | 2,125 | 2,191 | |||||
| Deferred Income Taxes | 1,143 | 1,160 | |||||
| Total Liabilities | 23,128 | 24,651 | |||||
| STOCKHOLDERS’ EQUITY | |||||||
| Common Stock, par value $0.05; authorized: 10 billion shares; issued: 1.754 billion shares at January 31, 2016 and 1.733 billion shares at February 1, 2015; outstanding: 1.484 billion shares at January 31, 2016 and 1.537 billion shares at February 1, 2015 | 77 | 76 | |||||
| Paid-In Capital | 6,290 | 6,037 | |||||
| Retained Earnings | 11,694 | 11,794 | |||||
| Accumulated Other Comprehensive Income | 361 | 81 | |||||
| Treasury Stock, at cost, 270 million shares at January 31, 2016 and 196 million shares at February 1, 2015 | (587 | ) | (385 | ) | |||
| Total Stockholders’ Equity | 17,835 | 17,441 | |||||
| Total Liabilities and Stockholders’ Equity | $ | 40,963 | $ | 42,092 | |||
Selected information as on February 2, 2014:
| Working capital | $ | 2,658 | ||
| Cash balance | $ | 1,290 | ||
| Total assets | $ | 44,344 | ||
| Stockholders' equity | $ | 17,739 | ||
rev: 04_07_2020_QC_CS-207273, CS-207274
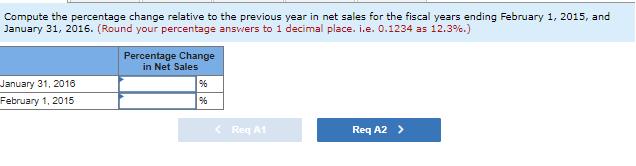
a-1. Compute the percentage change relative to the previous year in net sales for the fiscal years ending February 1, 2015, and January 31, 2016.
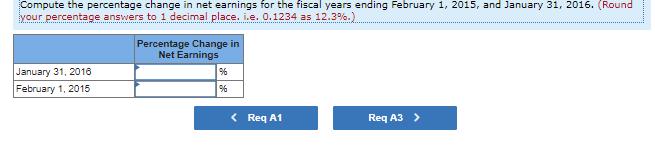
a-2. Compute the percentage change in net earnings for the fiscal years ending February 1, 2015, and January 31, 2016.
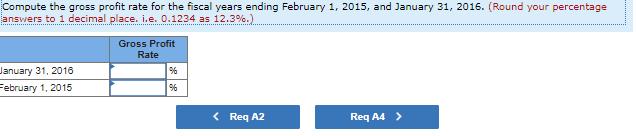
a-3. Compute the gross profit rate for the fiscal years ending February 1, 2015, and January 31, 2016.
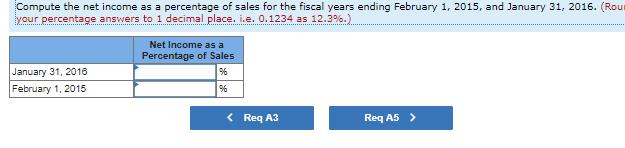
a-4. Compute the net income as a percentage of sales for the fiscal years ending February 1, 2015, and January 31, 2016.
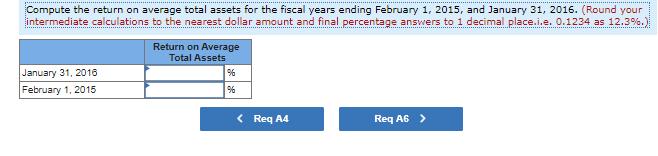
a-5. Compute the return on average total assets for the fiscal years ending February 1, 2015, and January 31, 2016.
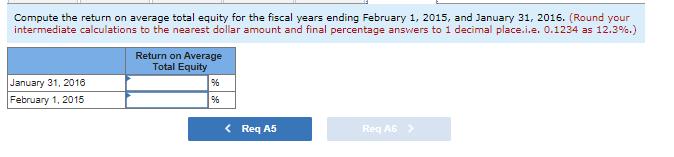
a-6. Compute the return on average total equity for the fiscal years ending February 1, 2015, and January 31, 2016.
Expert Answer:
a1 Percentage change in net sales relative to previous year Fiscal year ended February 1 2015 Net sales 71294 million Previous year February 2 2014 ne... View the full answer


Financial Reporting and Analysis
ISBN: 978-0078025679
6th edition
Authors: Flawrence Revsine, Daniel Collins, Bruce, Mittelstaedt, Leon
