

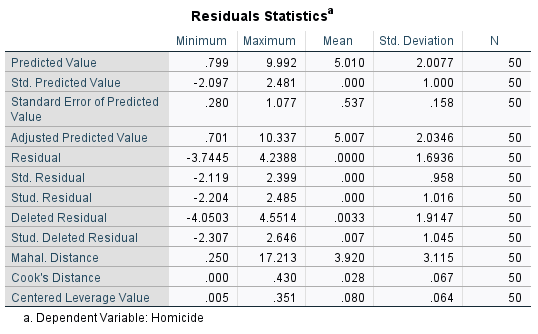
Residuals Statistics Minimum Maximum Mean Std. Deviation N Predicted Value .799 9.992 5.010 2.0077 50 Std....
Fantastic news! We've Found the answer you've been seeking!
Question:
Expert Answer:

Posted Date:
