

Revenue and expense data for the current calendar year for Tannenhill Company and for the electronics...
Fantastic news! We've Found the answer you've been seeking!
Question:
Transcribed Image Text:
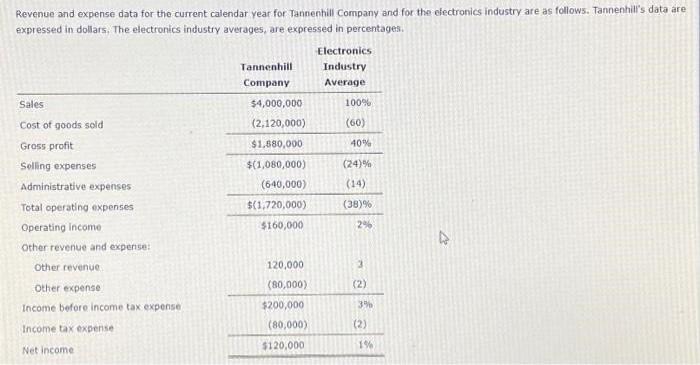
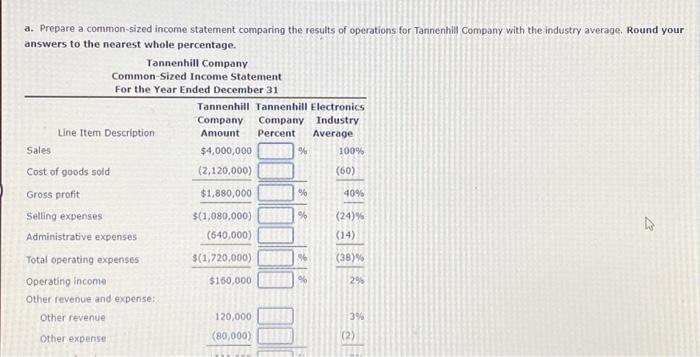
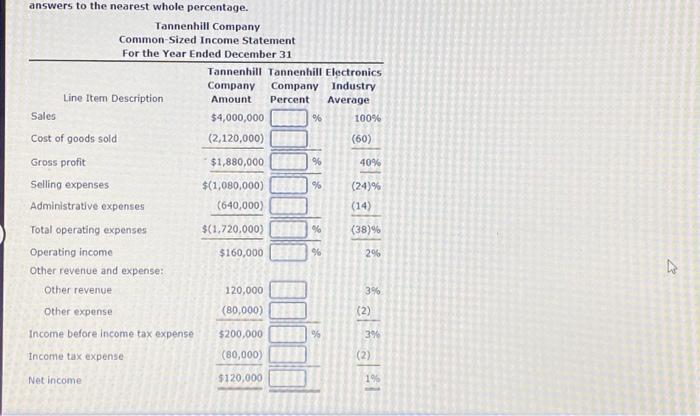
Revenue and expense data for the current calendar year for Tannenhill Company and for the electronics industry are as follows. Tannenhill's data are expressed in dollars. The electronics industry averages, are expressed in percentages. Tannenhill Electronics Industry Company Average Sales $4,000,000 100% Cost of goods sold (2,120,000) (60) Gross profit $1,880,000 40% Selling expenses $(1,080,000) (24)% Administrative expenses (640,000) (14) Total operating expenses $(1,720,000) (38)% Operating Income $160,000 2% Other revenue and expense: Other revenue 120,000 Other expense (80,000) (2) Income before income tax expense $200,000 3% Income tax expense (80,000) (2) Net income $120,000 1% a. Prepare a common-sized income statement comparing the results of operations for Tannenhill Company with the industry average. Round your answers to the nearest whole percentage. Tannenhill Company Common-Sized Income Statement For the Year Ended December 31 Tannenhill Tannenhill Electronics Company Company Industry Line Item Description Amount Percent Average Sales $4,000,000 % 100% Cost of goods sold (2,120,000) (60) Gross profit $1,880,000 % 40% Selling expenses $(1,080,000) % (24) % Administrative expenses (640,000) (14) Total operating expenses $(1,720,000) % (38)% Operating income $160,000 % 2% Other revenue and expense: Other revenue Other expense 120,000 3% (80,000) (2) answers to the nearest whole percentage. Tannenhill Company Common-Sized Income Statement For the Year Ended December 31. Line Item Description Sales Tannenhill Tannenhill Electronics Company Company Industry Amount Percent Average $4,000,000 % 100% Cost of goods sold (2,120,000) (60) Gross profit $1,880,000 % 40% Selling expenses $(1,080,000) % (24)% Administrative expenses (640,000) (14) Total operating expenses $(1,720,000) % (38)% Operating income $160,000 % 2% Other revenue and expense: Other revenue 120,000 3% Other expense (80,000) (2) Income before income tax expense $200,000 % 3% Income tax expense (80,000) (2) Net income $120,000 1% 13 Revenue and expense data for the current calendar year for Tannenhill Company and for the electronics industry are as follows. Tannenhill's data are expressed in dollars. The electronics industry averages, are expressed in percentages. Tannenhill Electronics Industry Company Average Sales $4,000,000 100% Cost of goods sold (2,120,000) (60) Gross profit $1,880,000 40% Selling expenses $(1,080,000) (24)% Administrative expenses (640,000) (14) Total operating expenses $(1,720,000) (38)% Operating Income $160,000 2% Other revenue and expense: Other revenue 120,000 Other expense (80,000) (2) Income before income tax expense $200,000 3% Income tax expense (80,000) (2) Net income $120,000 1% a. Prepare a common-sized income statement comparing the results of operations for Tannenhill Company with the industry average. Round your answers to the nearest whole percentage. Tannenhill Company Common-Sized Income Statement For the Year Ended December 31 Tannenhill Tannenhill Electronics Company Company Industry Line Item Description Amount Percent Average Sales $4,000,000 % 100% Cost of goods sold (2,120,000) (60) Gross profit $1,880,000 % 40% Selling expenses $(1,080,000) % (24) % Administrative expenses (640,000) (14) Total operating expenses $(1,720,000) % (38)% Operating income $160,000 % 2% Other revenue and expense: Other revenue Other expense 120,000 3% (80,000) (2) answers to the nearest whole percentage. Tannenhill Company Common-Sized Income Statement For the Year Ended December 31. Line Item Description Sales Tannenhill Tannenhill Electronics Company Company Industry Amount Percent Average $4,000,000 % 100% Cost of goods sold (2,120,000) (60) Gross profit $1,880,000 % 40% Selling expenses $(1,080,000) % (24)% Administrative expenses (640,000) (14) Total operating expenses $(1,720,000) % (38)% Operating income $160,000 % 2% Other revenue and expense: Other revenue 120,000 3% Other expense (80,000) (2) Income before income tax expense $200,000 % 3% Income tax expense (80,000) (2) Net income $120,000 1% 13
Expert Answer:

Posted Date:
Students also viewed these accounting questions
-
You are offered an annuity investment that will pay you $50,000 each year for the next 15 years, with the payments at the end of each year (first payment exactly one year from today at t=1). If you...
-
According to a study by the American Pet Food Dealers Association, 63% of U.S. house-holds own pets. A report is being prepared for an editorial in the San Francisco Chronicle. As a part of the...
-
The first quarter tax return needs to be filed for Prevosti Farms and Sugarhouse by April 15, 2019. For the purpose of the taxes, assume the second February payroll amounts were duplicated for the...
-
What is the difference between a cause of action and an affirmative defense?
-
The following transactions occurred during March 2013 for the Wainwright Corporation. The company owns and operates a wholesale warehouse. [These are the same transactions analyzed in Exercise 21,...
-
Charlie Lee has invested in stock of Izepodd Enterprise, a company that\'s been in business for about three years but has such a strong product line they expect to continue to offer their products...
-
What are your reactions to Andreas concern that as the phone replaces face-to-face interactions, her daughter won't be able to communicate or develop deeper, meaningful friendships? Is this a concern...
-
Among developed economies, which of the following sources of economic growth is most likely to explain superior growth performance? A. Technology B. Capital stock C. Labor supply
-
The most likely outcome when both aggregate supply and aggregate demand increase is: A. a rise in inflation. B. higher employment. C. an increase in nominal GDP.
-
Increased household wealth will most likely cause an increase in: A. household saving. B. investment expenditures. C. consumption expenditures.
-
Patent fees and legal services are recorded in which of the following balance of payments components? A. Capital account B. Current account C. Financial account
-
Which of the following is least likely to be caused by a shift in aggregate demand? A. Stagflation B. A recessionary gap C. An inflationary gap
-
Read the case study Free trade for STEET the debate continues and answer the question: Who loses and who gains when the U.S puts tariffs on steel? Examine the issue from a range of perspectives,...

Study smarter with the SolutionInn App