

RITY (Percent of terrorists caught) The blue curve on the following graph shows the tradeoff between...
Fantastic news! We've Found the answer you've been seeking!
Question:
Transcribed Image Text:
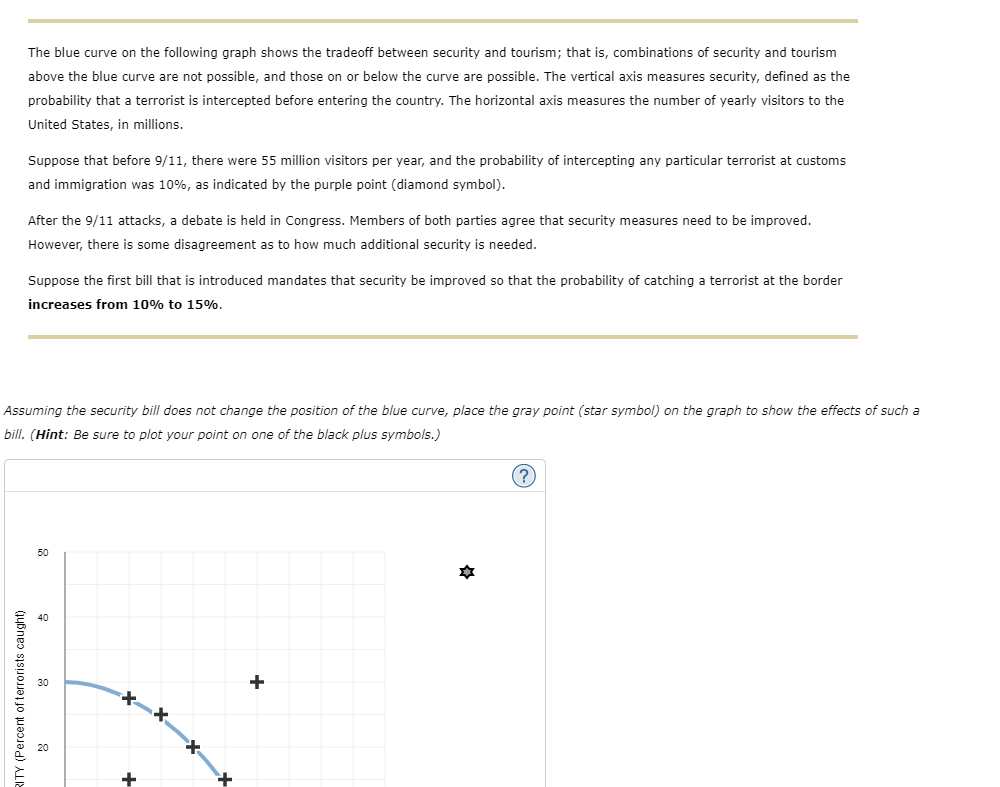
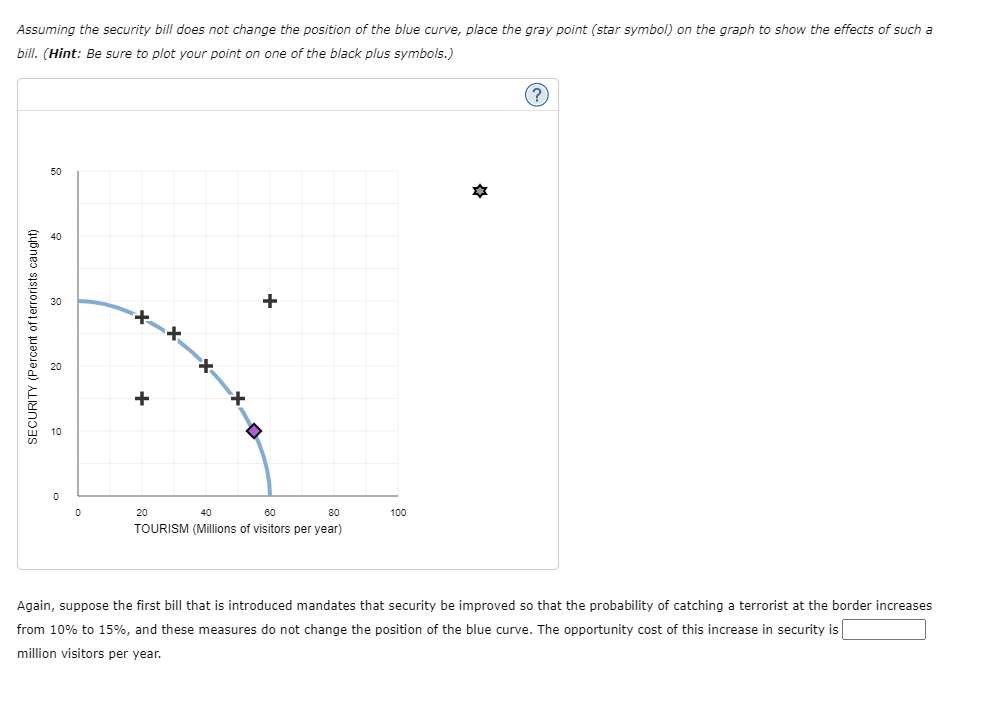
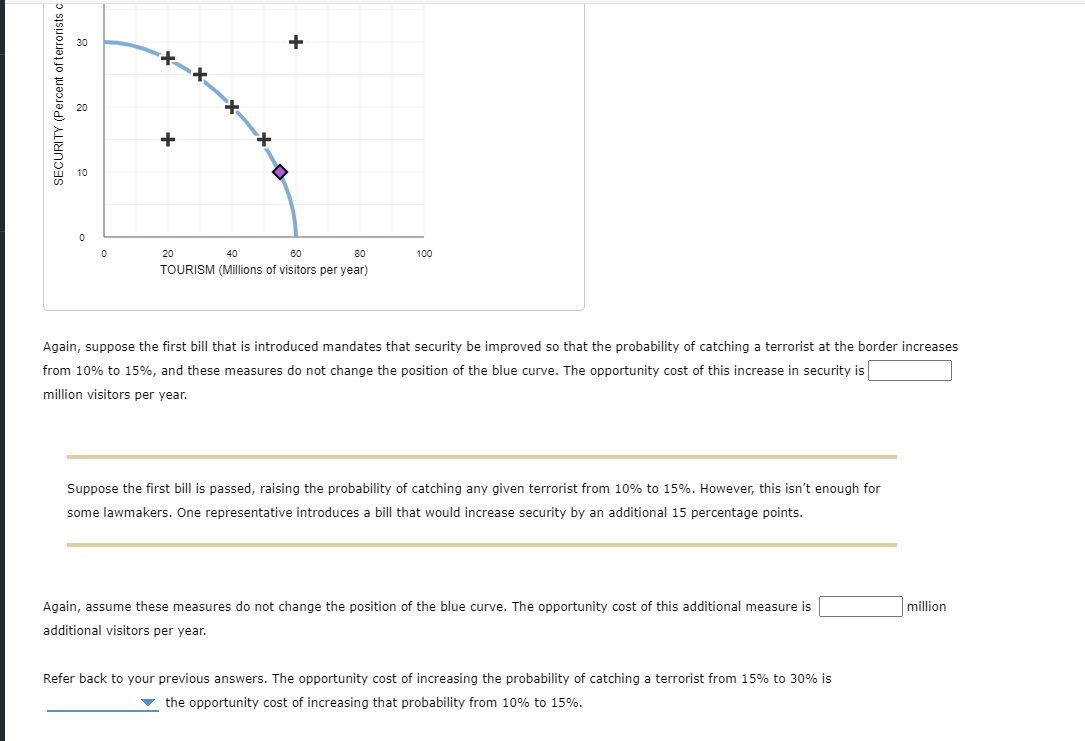
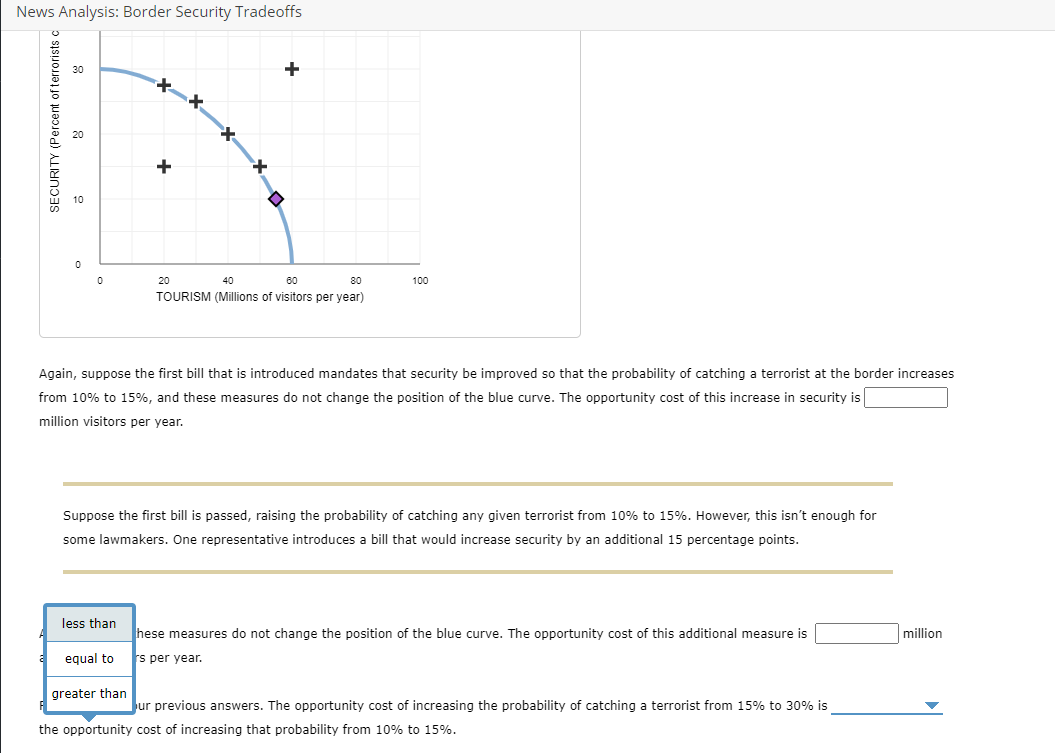
RITY (Percent of terrorists caught) The blue curve on the following graph shows the tradeoff between security and tourism; that is, combinations of security and tourism above the blue curve are not possible, and those on or below the curve are possible. The vertical axis measures security, defined as the probability that a terrorist is intercepted before entering the country. The horizontal axis measures the number of yearly visitors to the United States, in millions. Suppose that before 9/11, there were 55 million visitors per year, and the probability of intercepting any particular terrorist at customs and immigration was 10%, as indicated by the purple point (diamond symbol). After the 9/11 attacks, a debate is held in Congress. Members of both parties agree that security measures need to be improved. However, there is some disagreement as to how much additional security is needed. Suppose the first bill that is introduced mandates that security be improved so that the probability of catching a terrorist at the border increases from 10% to 15%. Assuming the security bill does not change the position of the blue curve, place the gray point (star symbol) on the graph to show the effects of such a bill. (Hint: Be sure to plot your point on one of the black plus symbols.) 30 40 50 (?) Assuming the security bill does not change the position of the blue curve, place the gray point (star symbol) on the graph to show the effects of such a bill. (Hint: Be sure to plot your point on one of the black plus symbols.) SECURITY (Percent of terrorists caught) 50 30 8 10 + 20 40 + 60 80 100 TOURISM (Millions of visitors per year) Again, suppose the first bill that is introduced mandates that security be improved so that the probability of catching a terrorist at the border increases from 10% to 15%, and these measures do not change the position of the blue curve. The opportunity cost of this increase in security is million visitors per year. SECURITY (Percent of terrorists c 30 8 + 0 0 20 40 60 80 100 TOURISM (Millions of visitors per year) Again, suppose the first bill that is introduced mandates that security be improved so that the probability of catching a terrorist at the border increases from 10% to 15%, and these measures do not change the position of the blue curve. The opportunity cost of this increase in security is million visitors per year. Suppose the first bill is passed, raising the probability of catching any given terrorist from 10% to 15%. However, this isn't enough for some lawmakers. One representative introduces a bill that would increase security by an additional 15 percentage points. Again, assume these measures do not change the position of the blue curve. The opportunity cost of this additional measure is additional visitors per year. million Refer back to your previous answers. The opportunity cost of increasing the probability of catching a terrorist from 15% to 30% is the opportunity cost of increasing that probability from 10% to 15%. News Analysis: Border Security Tradeoffs SECURITY (Percent of terrorists c 30 10 + 0 0 20 40 60 80 100 TOURISM (Millions of visitors per year) Again, suppose the first bill that is introduced mandates that security be improved so that the probability of catching a terrorist at the border increases from 10% to 15%, and these measures do not change the position of the blue curve. The opportunity cost of this increase in security is million visitors per year. Suppose the first bill is passed, raising the probability of catching any given terrorist from 10% to 15%. However, this isn't enough for some lawmakers. One representative introduces a bill that would increase security by an additional 15 percentage points. less than hese measures do not change the position of the blue curve. The opportunity cost of this additional measure is equal to s per year. greater than Jur previous answers. The opportunity cost of increasing the probability of catching a terrorist from 15% to 30% is the opportunity cost of increasing that probability from 10% to 15%. million RITY (Percent of terrorists caught) The blue curve on the following graph shows the tradeoff between security and tourism; that is, combinations of security and tourism above the blue curve are not possible, and those on or below the curve are possible. The vertical axis measures security, defined as the probability that a terrorist is intercepted before entering the country. The horizontal axis measures the number of yearly visitors to the United States, in millions. Suppose that before 9/11, there were 55 million visitors per year, and the probability of intercepting any particular terrorist at customs and immigration was 10%, as indicated by the purple point (diamond symbol). After the 9/11 attacks, a debate is held in Congress. Members of both parties agree that security measures need to be improved. However, there is some disagreement as to how much additional security is needed. Suppose the first bill that is introduced mandates that security be improved so that the probability of catching a terrorist at the border increases from 10% to 15%. Assuming the security bill does not change the position of the blue curve, place the gray point (star symbol) on the graph to show the effects of such a bill. (Hint: Be sure to plot your point on one of the black plus symbols.) 30 40 50 (?) Assuming the security bill does not change the position of the blue curve, place the gray point (star symbol) on the graph to show the effects of such a bill. (Hint: Be sure to plot your point on one of the black plus symbols.) SECURITY (Percent of terrorists caught) 50 30 8 10 + 20 40 + 60 80 100 TOURISM (Millions of visitors per year) Again, suppose the first bill that is introduced mandates that security be improved so that the probability of catching a terrorist at the border increases from 10% to 15%, and these measures do not change the position of the blue curve. The opportunity cost of this increase in security is million visitors per year. SECURITY (Percent of terrorists c 30 8 + 0 0 20 40 60 80 100 TOURISM (Millions of visitors per year) Again, suppose the first bill that is introduced mandates that security be improved so that the probability of catching a terrorist at the border increases from 10% to 15%, and these measures do not change the position of the blue curve. The opportunity cost of this increase in security is million visitors per year. Suppose the first bill is passed, raising the probability of catching any given terrorist from 10% to 15%. However, this isn't enough for some lawmakers. One representative introduces a bill that would increase security by an additional 15 percentage points. Again, assume these measures do not change the position of the blue curve. The opportunity cost of this additional measure is additional visitors per year. million Refer back to your previous answers. The opportunity cost of increasing the probability of catching a terrorist from 15% to 30% is the opportunity cost of increasing that probability from 10% to 15%. News Analysis: Border Security Tradeoffs SECURITY (Percent of terrorists c 30 10 + 0 0 20 40 60 80 100 TOURISM (Millions of visitors per year) Again, suppose the first bill that is introduced mandates that security be improved so that the probability of catching a terrorist at the border increases from 10% to 15%, and these measures do not change the position of the blue curve. The opportunity cost of this increase in security is million visitors per year. Suppose the first bill is passed, raising the probability of catching any given terrorist from 10% to 15%. However, this isn't enough for some lawmakers. One representative introduces a bill that would increase security by an additional 15 percentage points. less than hese measures do not change the position of the blue curve. The opportunity cost of this additional measure is equal to s per year. greater than Jur previous answers. The opportunity cost of increasing the probability of catching a terrorist from 15% to 30% is the opportunity cost of increasing that probability from 10% to 15%. million
Expert Answer:

Related Book For 

Macroeconomics
ISBN: 9780132109994
1st Edition
Authors: Glenn Hubbard, Anthony Patrick O'Brien, Matthew P Rafferty
Posted Date:
Students also viewed these accounting questions
-
Managing Scope Changes Case Study Scope changes on a project can occur regardless of how well the project is planned or executed. Scope changes can be the result of something that was omitted during...
-
for this case study carefully read the article titled "The Case for Reparations" The Atlantic Introduction Provide an overview of the situation Identify critical issues underlying the problems...
-
IfAUB=AUC and An B=An C, then B = C. Statement-2 AU (BOC) = (AUB) n (AUC)
-
Use implicit differentiation to find an equation of the tangent line to the curve at the given point. y sin 2x = x cos 2y, (/2, /4)
-
After all of the account balances have been extended to the Balance Sheet columns of the work sheet, the totals of the Debit and Credit columns are $28,246 and $21,306, respectively. What is the...
-
Figure P5.94 shows the mixing of two streams. The shear stress between each fluid and its adjacent walls is negligible. Why can't Bernoulli's equation be applied between points in stream 1 and the...
-
Sinise Industries acquired two copyrights during 2010. One copyright related to a textbook that was developed internally at a cost of $9,900. This textbook is estimated to have a useful life of 3...
-
You plan to invest $10,000 into your new savings account the end of the year for the next 10 years. The interest earned in the account is 8% per year. How much do you expect to have in the account at...
-
A thirty year term life premium for a 35 year old is roughly 0.1%. What would be the monthly premium for a $1 million policy? A whole life policy for the same 35 year old is roughly 10x as expensive...
-
Tatonka Inc. has a stock price of $45 and 50 million shares outstanding in the market. The company's balance sheet lists total equity of $1.5 billion. What is the company's market-to-book ratio?
-
CoursHeroTranscribedText The following class will deadlocked by invoking method t(). Explain Why? class A{ private Semaphore sem; public A(){ sem= new Semaphore(0); } synchronized void t(){ try{ sem....
-
How do we examine the political platforms and policies that are put forward in the two major political parties?
-
At a specific RPM (revolutions per minute) for a diesel engine, a strong resonance at a frequency of 250Hz and wavelength of 2.4 m are observed in the exhaust pipe (pipe with constant cross section)...
-
What are the implications of technological advancements and automation on the future prospects of social mobility, particularly for low-skilled workers ?
-
Write a paper in which you address the following: 1. Introduction of relevant accounting standards. Make some comparison (iasb/fasb/cas/ifrs) 2. Evaluate the effectiveness of standards (relevance VS...
-
Aztec Furnishings makes hand-crafted furniture for sale in its retail stores. The furniture maker has recently installed a new assembly process, including a new sander and polisher. With this new...
-
Exercise 4.17 discusses an experiment done in Africa testing possible ways to reduce the spread of malaria by mosquitoes. In the experiment, 43 volunteers were randomly assigned to consume either a...
-
If lizards adapt their behavior to the fire ants, then lizards from the invaded habitats should twitch more than lizards from uninvaded habitats when exposed to red imported fire ants (twitching...
-
If lizards adapt their behavior to the fire ants, then lizards from the invaded habitats should flee from the fire ants faster than lizards from the uninvaded habitats. Test this hypothesis. The...

Study smarter with the SolutionInn App