

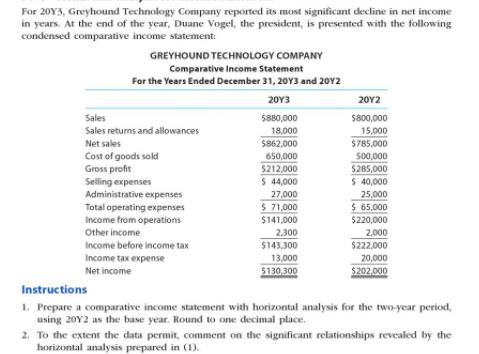
For 20Y3, Greyhound Technology Company reported its most significant decline in net income in years. At...
Fantastic news! We've Found the answer you've been seeking!
Question:
Expert Answer:

Related Book For 

Posted Date:
