

See the table far below showing financial statement data and stock price data for Mydeco Corp....
Fantastic news! We've Found the answer you've been seeking!
Question:

Transcribed Image Text:
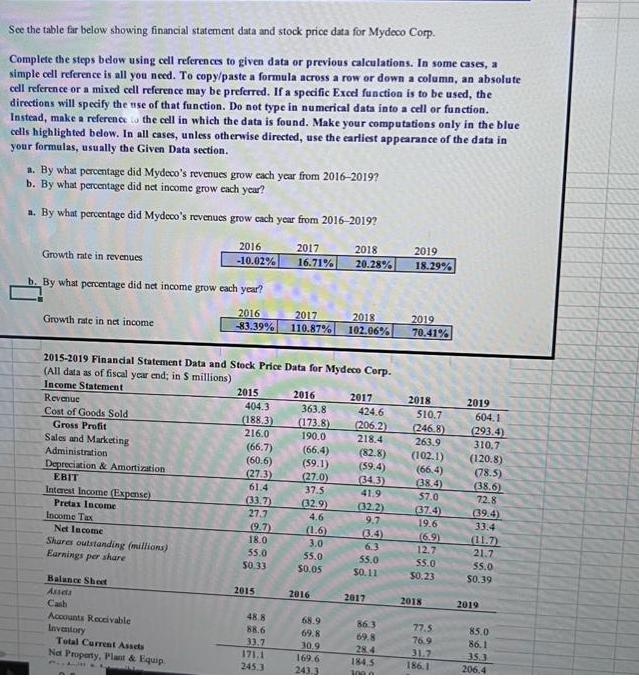
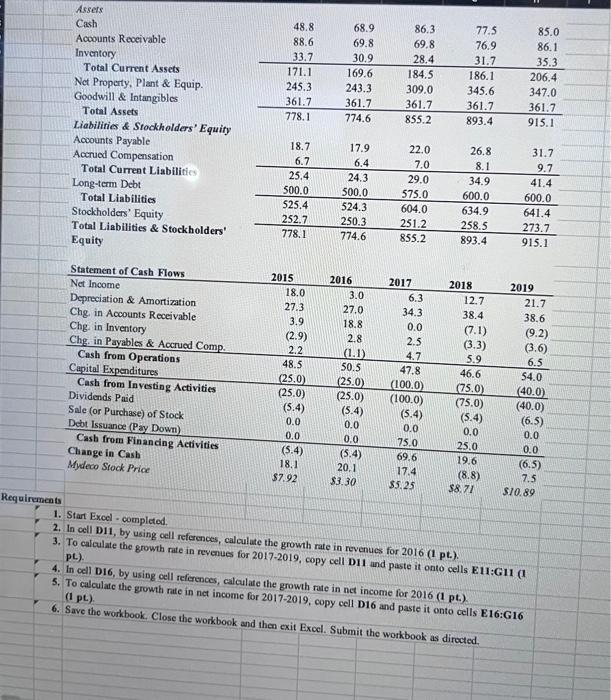
See the table far below showing financial statement data and stock price data for Mydeco Corp. Complete the steps below using cell references to given data or previous calculations. In some cases, a simple cell reference is all you need. To copy/paste a formula across a row or down a column, an absolute cell reference or a mixed cell reference may be preferred. If a specific Excel function is to be used, the directions will specify the use of that function. Do not type in numerical data into a cell or function. Instead, make a reference to the cell in which the data is found. Make your computations only in the blue cells highlighted below. In all cases, unless otherwise directed, use the earliest appearance of the data in your formulas, usually the Given Data section. a. By what percentage did Mydeco's revenues grow each year from 2016-2019? b. By what percentage did net income grow each year? a. By what percentage did Mydeco's revenues grow each year from 2016-2019? Growth rate in revenues b. By what percentage did net income grow each year? 0 Growth rate in net income Cost of Goods Sold Gross Profit Sales and Marketing Administration Depreciation & Amortization EBIT Interest Income (Expense) Pretax Income Income Tax 2015-2019 Financial Statement Data and Stock Price Data for Mydeco Corp. (All data as of fiscal year end; in S millions) Income Statement Revenue Net Income Shares outstanding (millions) Earnings per share 2016 -10.02% Balance Sheet Assets Cash Accounts Receivable Inventory Total Current Assets Not Property, Plant & Equip 44E 2016 2017 2018 -83.39% 110.87% 102.06% 2015 404.3 (188.3) 216.0 (66.7) (60.6) (27.3) 61.4 (33.7) 27.7 (9.7) 18.0 55.0 50.33 2017 16.71% 2015 48.8 88.6 33.7 171.1 245,3 2016 363.8 (173.8) 190.0 (66.4) (59.1) (27.0) 37.5 (32.9) 4.6 (1.6) 3.0 55.0 $0.05 2016 2018 20.28% 68.9 69.8 30.9 169.6 243.3 2017 424.6 (206.2) 218.4 (82.8) (59.4) (34.3) 41.9 (32.2) 9.7 (3.4) 6.3 55.0 $0.11 2017 86.3 69.8 28.4 184.5 1000 2019 18.29% 2019 70.41% 2018 510.7 (246.8) 263.9 (102.1) (66.4) (38.4) $7.0 (37.4) 19.6 (6.9) 12.7 55.0 $0.23 2018 77.5 76.9 31.7 186.1 2019 604.1 (293.4) 310.7 (120.8) (78.5) (38.6) 72.8 (39.4) 33.4 (11.7) 21.7 55.0 $0.39 2019 85.0 86.1 35.3 206.4 Administration Depreciation & Amortization EBIT Interest Income (Expense) Pretax Income Income Tax Net Income Shares outstanding (millions) Earnings per share Balance Sheet Assets Cash Accounts Receivable Inventory Total Current Assets Net Property, Plant & Equip. Goodwill & Intangibles Total Assets Liabilities & Stockholders' Equity Accounts Payable Accrued Compensation Total Current Liabilities Long-term Debt Total Liabilities Stockholders' Equity Total Liabilities & Stockholders' Equity Statement of Cash Flows Net Income Depreciation & Amortization Chg. in Accounts Receivable Chg. in Inventory Chg. in Payables & Accrued Comp. Cash from Operations Capital Expenditures Cash from Investing Activities Dividends Paid Sale (or Purchase) of Stock Debt Issuance (Pay Down) Cash from Financing Activities Change in Cash Mydeco Stock Price (60.6) (27.3) 61.4 (33.7) 27.7 (9.7) 18.0 55.0 $0.33 2015 48.8 88.6 33.7 171.1 245.3 361.7 778.1 18.7 6.7 25.4 500.0 525.4 252.7 778.1 2015 18.0 27.3 3.9 (2.9) 2.2 48.5 (25.0) (25.0) (5.4) 0.0 0.0 (5.4) 18.1 $7.92 (59.1) (27.0) 37.5 (32.9) 4.6 (1.6) 3.0 55.0 $0.05 2016 68.9 69.8 30.9 169.6 243.3 361.7 774.6 17.9 6.4 24.3 500.0 524.3 250.3 774.6 2016 3.0 27.0 18.8 2.8 20.1 $3.30 (59.4) (34.3) 41.9 (32.2) 9.7 (3.4) 6.3 55.0 $0.11 2017 86.3 69.8 28.4 184.5 309.0 361.7 855.2 2017 22.0 7.0 29.0 575.0 604.0 251.2 855.2 6.3 34.3 0.0 2.5 4.7 50.5 47.8 (25.0) (100.0) (25.0) (100.0) (5.4) (5.4) 0.0 0.0 0.0 75.0 (5.4) 9.6 17.4 $5.25 (66.4) (38.4) 57.0 (37.4) 19.6 (6.9) 2018 12.7 $0.23 55.0 2018 77.5 76.9 31.7 186.1 345.6 361.7 893.4 26.8 8.1 34.9 600.0 634.9 258.5 893.4 $8.71 12.7 38.4 (7.1) (3.3) 5.9 46.6 (75.0) (75.0) (5.4) 0.0 25.0 19.6 (8.8) (120.8) (78.5) (38.6) 72.8 (39.4) 33.4 (11.7) 21.7 55.0 $0.39 2019 85.0 86.1 35.3 206.4 2019 347.0 361.7 915.1 31.7 9.7 41.4 600.0 641.4 273.7 915.1 21.7 38.6 (9.2) (3.6) 6.5 54.0 (40.0) (40.0) (6.5) 0.0 0.0 (6.5) 7.5 $10.89 Requirements Assets Cash Accounts Receivable Inventory Total Current Assets Net Property, Plant & Equip. Goodwill & Intangibles Total Assets Liabilities & Stockholders' Equity Accounts Payable Accrued Compensation Total Current Liabilities) Long-term Debt Total Liabilities Stockholders' Equity Total Liabilities & Stockholders' Equity Statement of Cash Flows Net Income Depreciation & Amortization Chg. in Accounts Receivable Chg. in Inventory Chg. in Payables & Accrued Comp. Cash from Operations Capital Expenditures Cash from Investing Activities Dividends Paid Sale (or Purchase) of Stock Debt Issuance (Pay Down) Cash from Financing Activities Change in Cash Mydeco Stock Price 48.8 88.6 33.7 171.1 245.3 361.7 778.1 18.7 6.7 25.4 500.0 525.4 252.7 778.1 2015 18.0 27.3 3.9 (2.9) 2.2 48.5 (25.0) (25.0) (5.4) 0.0 0.0 (5.4) 18.1 $7.92 68.9 69.8 30.9 169.6 243.3 361.7 774.6 17.9 6.4 24.3 500.0 524.3 250.3 774.6 2016 3.0 27.0 18.8 0.0 (5.4) 20.1 $3.30 86.3 69.8 28.4 184.5 309.0 361.7 855.2 22.0 7.0 29.0 575.0 604.0 251,2 855.2 2017 6.3 34.3 0.0 2.5 4.7 47.8 2.8 (1.1) 50.5 (25.0) (100.0) (25.0) (100.0) (5.4) (5.4) 0.0 0.0 75.0 69.6 17.4 $5.25 186.1 345.6 361.7 893.4 77.5 76.9 31.7 26.8 8.1 34.9 600.0 634.9 258.5 893.4 2018 12.7 38.4 (7.1) (3.3) 5.9 46.6 (75.0) (75.0) (5.4) 0.0 25.0 19.6 (8.8) $8.71 85.0 86.1 35.3 206.4 347.0 361.7 915.1 31.7 9.7 41.4 600.0 641.4 273.7 915.1 2019 21.7 38.6 (9.2) (3.6) 6.5 54.0 (40.0) (40.0) (6.5) 0.0 0.0 (6.5) 7.5 $10.89 1. Start Excel - completed. 2. In cell D11, by using cell references, calculate the growth rate in revenues for 2016 (1 pt.). 3. To calculate the growth rate in revenues for 2017-2019, copy cell D11 and paste it onto cells E11:G11 (1) pt.). 4. In cell D16, by using cell references, calculate the growth rate in net income for 2016 (1 pt.). 5. To calculate the growth rate in net income for 2017-2019, copy cell D16 and paste it onto cells E16:G16 (1 pt.). 6. Save the workbook. Close the workbook and then exit Excel. Submit the workbook as directed. See the table far below showing financial statement data and stock price data for Mydeco Corp. Complete the steps below using cell references to given data or previous calculations. In some cases, a simple cell reference is all you need. To copy/paste a formula across a row or down a column, an absolute cell reference or a mixed cell reference may be preferred. If a specific Excel function is to be used, the directions will specify the use of that function. Do not type in numerical data into a cell or function. Instead, make a reference to the cell in which the data is found. Make your computations only in the blue cells highlighted below. In all cases, unless otherwise directed, use the earliest appearance of the data in your formulas, usually the Given Data section. a. By what percentage did Mydeco's revenues grow each year from 2016-2019? b. By what percentage did net income grow each year? a. By what percentage did Mydeco's revenues grow each year from 2016-2019? Growth rate in revenues b. By what percentage did net income grow each year? 0 Growth rate in net income Cost of Goods Sold Gross Profit Sales and Marketing Administration Depreciation & Amortization EBIT Interest Income (Expense) Pretax Income Income Tax 2015-2019 Financial Statement Data and Stock Price Data for Mydeco Corp. (All data as of fiscal year end; in S millions) Income Statement Revenue Net Income Shares outstanding (millions) Earnings per share 2016 -10.02% Balance Sheet Assets Cash Accounts Receivable Inventory Total Current Assets Not Property, Plant & Equip 44E 2016 2017 2018 -83.39% 110.87% 102.06% 2015 404.3 (188.3) 216.0 (66.7) (60.6) (27.3) 61.4 (33.7) 27.7 (9.7) 18.0 55.0 50.33 2017 16.71% 2015 48.8 88.6 33.7 171.1 245,3 2016 363.8 (173.8) 190.0 (66.4) (59.1) (27.0) 37.5 (32.9) 4.6 (1.6) 3.0 55.0 $0.05 2016 2018 20.28% 68.9 69.8 30.9 169.6 243.3 2017 424.6 (206.2) 218.4 (82.8) (59.4) (34.3) 41.9 (32.2) 9.7 (3.4) 6.3 55.0 $0.11 2017 86.3 69.8 28.4 184.5 1000 2019 18.29% 2019 70.41% 2018 510.7 (246.8) 263.9 (102.1) (66.4) (38.4) $7.0 (37.4) 19.6 (6.9) 12.7 55.0 $0.23 2018 77.5 76.9 31.7 186.1 2019 604.1 (293.4) 310.7 (120.8) (78.5) (38.6) 72.8 (39.4) 33.4 (11.7) 21.7 55.0 $0.39 2019 85.0 86.1 35.3 206.4 Administration Depreciation & Amortization EBIT Interest Income (Expense) Pretax Income Income Tax Net Income Shares outstanding (millions) Earnings per share Balance Sheet Assets Cash Accounts Receivable Inventory Total Current Assets Net Property, Plant & Equip. Goodwill & Intangibles Total Assets Liabilities & Stockholders' Equity Accounts Payable Accrued Compensation Total Current Liabilities Long-term Debt Total Liabilities Stockholders' Equity Total Liabilities & Stockholders' Equity Statement of Cash Flows Net Income Depreciation & Amortization Chg. in Accounts Receivable Chg. in Inventory Chg. in Payables & Accrued Comp. Cash from Operations Capital Expenditures Cash from Investing Activities Dividends Paid Sale (or Purchase) of Stock Debt Issuance (Pay Down) Cash from Financing Activities Change in Cash Mydeco Stock Price (60.6) (27.3) 61.4 (33.7) 27.7 (9.7) 18.0 55.0 $0.33 2015 48.8 88.6 33.7 171.1 245.3 361.7 778.1 18.7 6.7 25.4 500.0 525.4 252.7 778.1 2015 18.0 27.3 3.9 (2.9) 2.2 48.5 (25.0) (25.0) (5.4) 0.0 0.0 (5.4) 18.1 $7.92 (59.1) (27.0) 37.5 (32.9) 4.6 (1.6) 3.0 55.0 $0.05 2016 68.9 69.8 30.9 169.6 243.3 361.7 774.6 17.9 6.4 24.3 500.0 524.3 250.3 774.6 2016 3.0 27.0 18.8 2.8 20.1 $3.30 (59.4) (34.3) 41.9 (32.2) 9.7 (3.4) 6.3 55.0 $0.11 2017 86.3 69.8 28.4 184.5 309.0 361.7 855.2 2017 22.0 7.0 29.0 575.0 604.0 251.2 855.2 6.3 34.3 0.0 2.5 4.7 50.5 47.8 (25.0) (100.0) (25.0) (100.0) (5.4) (5.4) 0.0 0.0 0.0 75.0 (5.4) 9.6 17.4 $5.25 (66.4) (38.4) 57.0 (37.4) 19.6 (6.9) 2018 12.7 $0.23 55.0 2018 77.5 76.9 31.7 186.1 345.6 361.7 893.4 26.8 8.1 34.9 600.0 634.9 258.5 893.4 $8.71 12.7 38.4 (7.1) (3.3) 5.9 46.6 (75.0) (75.0) (5.4) 0.0 25.0 19.6 (8.8) (120.8) (78.5) (38.6) 72.8 (39.4) 33.4 (11.7) 21.7 55.0 $0.39 2019 85.0 86.1 35.3 206.4 2019 347.0 361.7 915.1 31.7 9.7 41.4 600.0 641.4 273.7 915.1 21.7 38.6 (9.2) (3.6) 6.5 54.0 (40.0) (40.0) (6.5) 0.0 0.0 (6.5) 7.5 $10.89 Requirements Assets Cash Accounts Receivable Inventory Total Current Assets Net Property, Plant & Equip. Goodwill & Intangibles Total Assets Liabilities & Stockholders' Equity Accounts Payable Accrued Compensation Total Current Liabilities) Long-term Debt Total Liabilities Stockholders' Equity Total Liabilities & Stockholders' Equity Statement of Cash Flows Net Income Depreciation & Amortization Chg. in Accounts Receivable Chg. in Inventory Chg. in Payables & Accrued Comp. Cash from Operations Capital Expenditures Cash from Investing Activities Dividends Paid Sale (or Purchase) of Stock Debt Issuance (Pay Down) Cash from Financing Activities Change in Cash Mydeco Stock Price 48.8 88.6 33.7 171.1 245.3 361.7 778.1 18.7 6.7 25.4 500.0 525.4 252.7 778.1 2015 18.0 27.3 3.9 (2.9) 2.2 48.5 (25.0) (25.0) (5.4) 0.0 0.0 (5.4) 18.1 $7.92 68.9 69.8 30.9 169.6 243.3 361.7 774.6 17.9 6.4 24.3 500.0 524.3 250.3 774.6 2016 3.0 27.0 18.8 0.0 (5.4) 20.1 $3.30 86.3 69.8 28.4 184.5 309.0 361.7 855.2 22.0 7.0 29.0 575.0 604.0 251,2 855.2 2017 6.3 34.3 0.0 2.5 4.7 47.8 2.8 (1.1) 50.5 (25.0) (100.0) (25.0) (100.0) (5.4) (5.4) 0.0 0.0 75.0 69.6 17.4 $5.25 186.1 345.6 361.7 893.4 77.5 76.9 31.7 26.8 8.1 34.9 600.0 634.9 258.5 893.4 2018 12.7 38.4 (7.1) (3.3) 5.9 46.6 (75.0) (75.0) (5.4) 0.0 25.0 19.6 (8.8) $8.71 85.0 86.1 35.3 206.4 347.0 361.7 915.1 31.7 9.7 41.4 600.0 641.4 273.7 915.1 2019 21.7 38.6 (9.2) (3.6) 6.5 54.0 (40.0) (40.0) (6.5) 0.0 0.0 (6.5) 7.5 $10.89 1. Start Excel - completed. 2. In cell D11, by using cell references, calculate the growth rate in revenues for 2016 (1 pt.). 3. To calculate the growth rate in revenues for 2017-2019, copy cell D11 and paste it onto cells E11:G11 (1) pt.). 4. In cell D16, by using cell references, calculate the growth rate in net income for 2016 (1 pt.). 5. To calculate the growth rate in net income for 2017-2019, copy cell D16 and paste it onto cells E16:G16 (1 pt.). 6. Save the workbook. Close the workbook and then exit Excel. Submit the workbook as directed.
Expert Answer:

Related Book For 

Posted Date:
Students also viewed these finance questions
-
Derby Chips is an international producer of corn chips. At the end of 2006, Mary Hahn, president of Derby, appointed a task force to focus on the packaging and product use segments of its products...
-
See Table 2.5 showing financial statement data and stock price data for Mydeco Corp. a. By what percentage did Mydecos revenues grow each year from 2010 to 2013? b. By what percentage did net income...
-
See Table 2.5 showing financial statement data and stock price data for Mydeco Corp. a. How did Mydecos accounts receivable days change over this period? b. How did Mydecos inventory days change over...
-
Reisen Travel offers helicopter service from suburban towns to John F. Kennedy International Airport in New York City. Each of its 10 helicopters makes between 1,000 and 2,000 round-trips per year....
-
Interpreting common-size income statements Exhibit 4.7 presents common-size income statements for Standard Denim and Blue Label Jeans, two apparel retailing firms, for three recent years. In addition...
-
Many of the firms treated had multiple plants. After the researchers left, what do you think they did about training in their other plants?
-
What is the internal rate of return of the following cash flow diagram? a. 20 percent b. 18.2 percent c. 17.5 percent d. 15 percent $30 $31 0 1 2 3 $30 $15
-
On January 1, 2012, Barwood Corporation granted 5,000 options to executives. Each option entitles the holder to purchase one share of Barwoods $5 par value common stock at $50 per share at any time...
-
What type of failure has occurred when a new-product introduction loses money for the company when accounting for development, marketing, and production costs?
-
# EDGAR - Reading Information Tables in Text Format - Advanced Text Mining # Do not use Beautiful Soup or any other parser for this assignment. Do not use NumPy or Pandas as well. #### So far, we...
-
For the beams shown in Figs. 1 and 2, determine: 1. Plane stress state 2. Principal stresses 3. Maximum in-plane she ar stress state with corresponding 4. Plot ALL stress st ates above 5. Plot Mohr...
-
Micro Spinoffs Incorporated issued 10-year debt a year ago at par value with a coupon rate of 8%, paid annually. Today, the debt is selling at $1,180. If the firm's tax bracket is 21%, what is its...
-
Ellie Inc. manufactures stuffed animals. During 2 0 2 3 , total costs incurred in making 1 0 , 0 0 0 stuffed animals included $ 5 5 , 0 0 0 of selling, general, and administrative costs. The selling...
-
Investment Center Net Income Average Assets Cameras and camcorders $ 6,450,000 $ 29,000,000 Phones and communications 2,982,000 21,300,000 Computers and accessories 1,050,000 17,400,000 Assume a...
-
A company is considering dropping a product line. Data from the company s budget for the upcoming year for this product line appear below: Sales Revenue: $ 4 2 5 , 0 0 0 Variable costs: $ 1 9 5 , 0 0...
-
A proposed wind farm installation is based on the use of fourteen 2.5 MW wind turbines. The installed capital cost is estimated at $1100/kW & the annual operation & maintenance costs are estimated to...
-
a) Evaluate the limit lim x-x-2 x-2 x-2 ******* b) The function f(x) is given by f(x) = x-x-2 X-2 x+2 I +c if x < 2 if > 2 Using part a), find the value of e so that lim-2 f(z) exists.
-
What is the maximum volume of 0.25 M sodium hypochlorite solution (NaOCl, laundry bleach) that can be prepared by dilution of 1.00 L of 0.80 M NaOCl?
-
Arnold Inc. is considering a proposal to manufacture high-end protein bars used as food supplements by body builders. The project requires use of an existing warehouse, which the firm acquired three...
-
Redo Problem 21, but assume the following: a. Investors pay a 15% tax on dividends but no capital gains taxes or taxes on interest income, and Kay does not pay corporate taxes. b. Investors pay a 15%...
-
Your brother has offered to give you $100, starting next year, and after that growing at 3% for the next 20 years. You would like to calculate the value of this offer by calculating how much money...
-
What is an off-by-one error?
-
Will the universality of management continue to be true in the future? Why or why not?
-
Describe what a manager does. How does the work of managers differ from that of nonmanagerial employees?

Study smarter with the SolutionInn App