

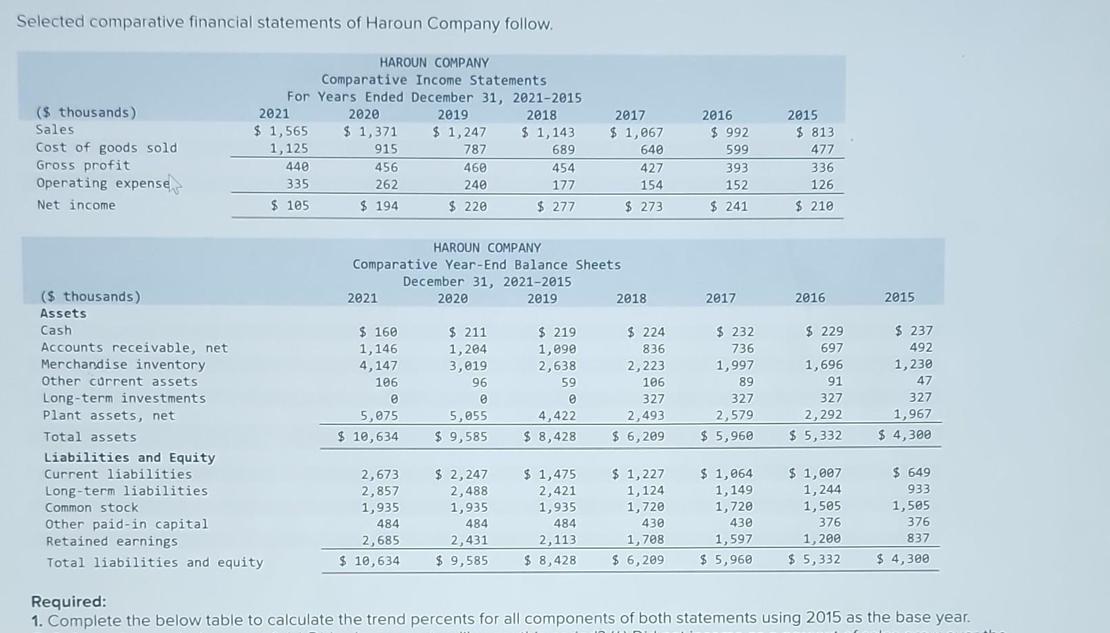
Selected comparative financial statements of Haroun Company follow. HAROUN COMPANY Comparative Income Statements For Years Ended...
Fantastic news! We've Found the answer you've been seeking!
Question:

Expert Answer:
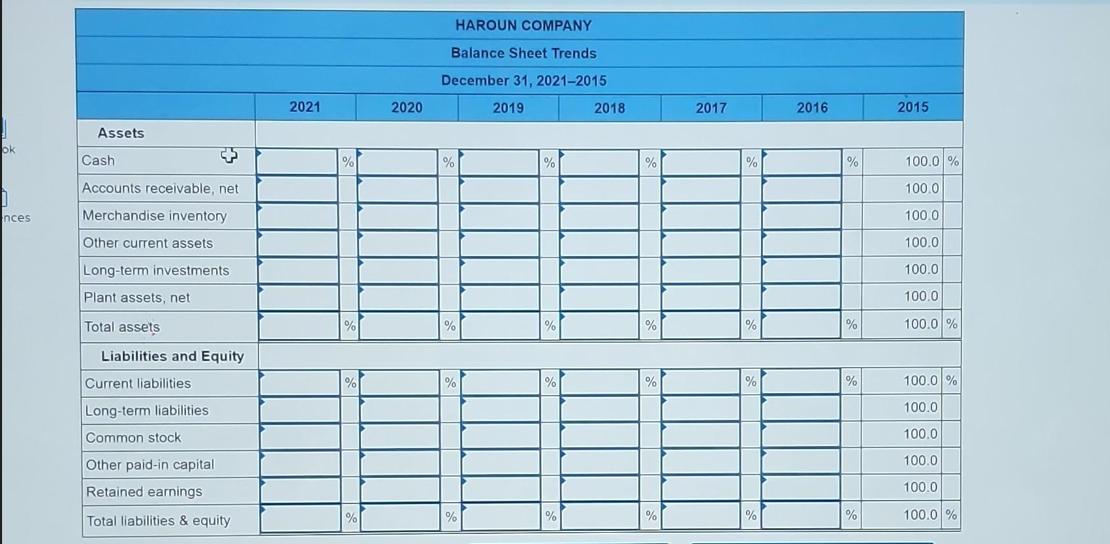
Trend Percentages for Balance Sheet Components To calculate the trend percentages for each component ... View the full answer

Related Book For 
Financial Accounting Information for Decisions
ISBN: 978-1259533006
8th edition
Authors: John J. Wild
Posted Date:
