

Selected risk ratios are presented for 2011 and 2010 for Techtron Company. Also, refer to the...
Fantastic news! We've Found the answer you've been seeking!
Question:
Transcribed Image Text:
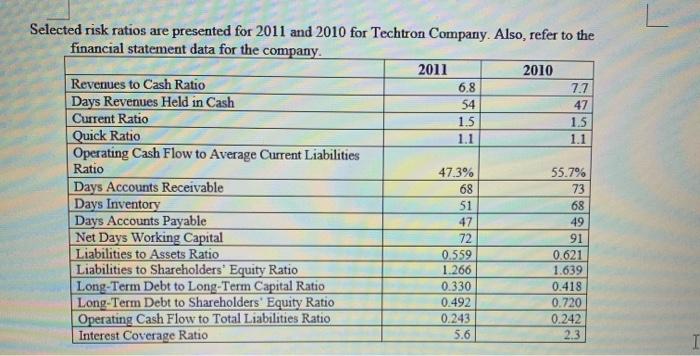
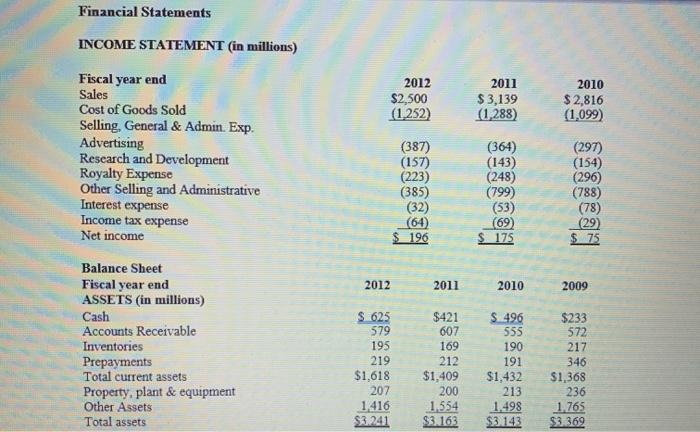
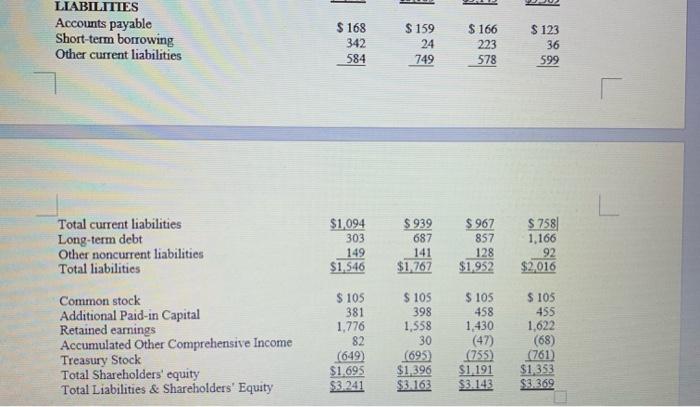
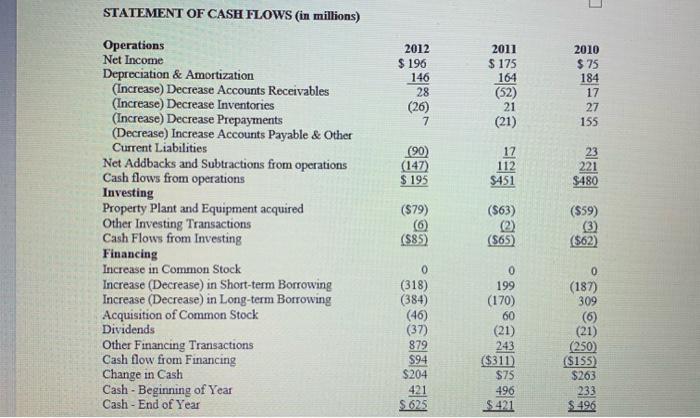
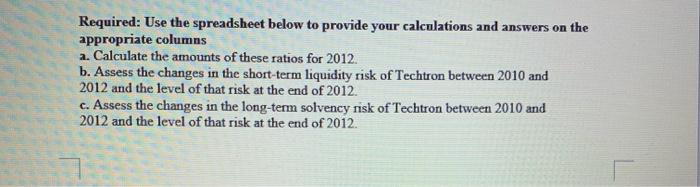
Selected risk ratios are presented for 2011 and 2010 for Techtron Company. Also, refer to the financial statement data for the company. 2011 2010 Revenues to Cash Ratio Days Revenues Held in Cash Current Ratio Quick Ratio Operating Cash Flow to Average Current Liabilities Ratio 6.8 7.7 54 47 1.5 1.5 1.1 1.1 47.3% 55.7% Days Accounts Receivable Days Inventory Days Accounts Payable Net Days Working Capital Liabilities to Assets Ratio Liabilities to Shareholders' Equity Ratio Long-Term Debt to Long-Term Capital Ratio Long-Term Debt to Shareholders' Equity Ratio Operating Cash Flow to Total Liabilities Ratio Interest Coverage Ratio 68 73 51 68 47 49 72 91 0.559 1.266 0.621 1.639 0.330 0.418 0.492 0.243 0.720 0.242 5.6 2.3 Financial Statements INCOME STATEMENT (in millions) Fiscal year end Sales Cost of Goods Sold 2012 2011 $2,500 (1,252) $3,139 (1,288) 2010 $2,816 (1,099) Selling, General & Admin. Exp. Advertising Research and Development Royalty Expense Other Selling and Administrative Interest expense Income tax expense Net income (387) (157) (223) (385) (32) (64) 196 (364) (143) (248) (799) (53) (69) $ 175 (297) (154) (296) (788) (78) (29) $ 75 Balance Sheet Fiscal year end ASSETS (in millions) Cash Accounts Receivable Inventories 2012 2011 2010 2009 $ 625 579 195 219 $1,618 207 S 496 55 190 Prepayments Total current assets Property, plant & equipment Other Assets Total assets $421 607 169 212 $1,409 200 $233 572 217 346 $1,368 236 1,765 $3.369 191 $1,432 213 1416 $3.241 1.554 $3.163 1.498 $3.143 LIABILITIES Accounts payable Short-term borrowing Other current liabilities $ 168 342 $ 159 $ 166 $ 123 24 749 223 36 599 584 578 $ 939 687 141 $1,767 $ 758 1,166 92 $2,016 Total current liabilities Long-term debt Other noncurrent liabilities Total liabilities $1,094 303 149 $1,546 $ 967 857 128 $1.952 Common stock Additional Paid-in Capital Retained earnings Accumulated Other Comprehensive Income Treasury Stock Total Shareholders' equity Total Liabilities & Shareholders' Equity $ 105 381 1,776 82 $ 105 398 1,558 30 (695) $1.396 $3.163 $ 105 458 1,430 (47) (755) $1.191 $3.143 $ 105 455 1,622 (68) (761) $1,353 $3.369 (649) $1.695 $3.241 STATEMENT OF CASH FLOWS (in millions) Operations Net Income 2012 2011 2010 $ 196 146 28 (26) $ 75 184 $ 175 164 (52) 21 Depreciation & Amortization (Increase) Decrease Accounts Receivables (Increase) Decrease Inventories (Increase) Decrease Prepayments (Decrease) Increase Accounts Payable & Other Current Liabilities Net Addbacks and Subtractions from operations Cash flows from operations Investing Property Plant and Equipment acquired Other Investing Transactions Cash Flows from Investing 17 27 (21) 155 (90) (147) $ 195 23 112 $451 221 $480 ($79) (6) (S85) ($63) (2) ($65) ($59) (3) ($62) Financing Increase in Common Stock 0. (187) 309 Increase (Decrease) in Short-term Borrowing Increase (Decrease) in Long-term Borrowing Acquisition of Common Stock Dividends Other Financing Transactions Cash flow from Financing Change in Cash Cash - Beginning of Year Cash - End of Year (318) (384) (46) (37) 879 $94 $204 199 (170) (21) 243 ($311) $75 (6) (21) (250) ($151 $263 233 $ 496 421 $ 625 496 $421 Required: Use the spreadsheet below to provide your calculations and answers on the appropriate columns a. Calculate the amounts of these ratios for 2012. b. Assess the changes in the short-term liquidity risk of Techtron between 2010 and 2012 and the level of that risk at the end of 2012. c. Assess the changes in the long-term solvency risk of Techtron between 2010 and 2012 and the level of that risk at the end of 2012. Selected risk ratios are presented for 2011 and 2010 for Techtron Company. Also, refer to the financial statement data for the company. 2011 2010 Revenues to Cash Ratio Days Revenues Held in Cash Current Ratio Quick Ratio Operating Cash Flow to Average Current Liabilities Ratio 6.8 7.7 54 47 1.5 1.5 1.1 1.1 47.3% 55.7% Days Accounts Receivable Days Inventory Days Accounts Payable Net Days Working Capital Liabilities to Assets Ratio Liabilities to Shareholders' Equity Ratio Long-Term Debt to Long-Term Capital Ratio Long-Term Debt to Shareholders' Equity Ratio Operating Cash Flow to Total Liabilities Ratio Interest Coverage Ratio 68 73 51 68 47 49 72 91 0.559 1.266 0.621 1.639 0.330 0.418 0.492 0.243 0.720 0.242 5.6 2.3 Financial Statements INCOME STATEMENT (in millions) Fiscal year end Sales Cost of Goods Sold 2012 2011 $2,500 (1,252) $3,139 (1,288) 2010 $2,816 (1,099) Selling, General & Admin. Exp. Advertising Research and Development Royalty Expense Other Selling and Administrative Interest expense Income tax expense Net income (387) (157) (223) (385) (32) (64) 196 (364) (143) (248) (799) (53) (69) $ 175 (297) (154) (296) (788) (78) (29) $ 75 Balance Sheet Fiscal year end ASSETS (in millions) Cash Accounts Receivable Inventories 2012 2011 2010 2009 $ 625 579 195 219 $1,618 207 S 496 55 190 Prepayments Total current assets Property, plant & equipment Other Assets Total assets $421 607 169 212 $1,409 200 $233 572 217 346 $1,368 236 1,765 $3.369 191 $1,432 213 1416 $3.241 1.554 $3.163 1.498 $3.143 LIABILITIES Accounts payable Short-term borrowing Other current liabilities $ 168 342 $ 159 $ 166 $ 123 24 749 223 36 599 584 578 $ 939 687 141 $1,767 $ 758 1,166 92 $2,016 Total current liabilities Long-term debt Other noncurrent liabilities Total liabilities $1,094 303 149 $1,546 $ 967 857 128 $1.952 Common stock Additional Paid-in Capital Retained earnings Accumulated Other Comprehensive Income Treasury Stock Total Shareholders' equity Total Liabilities & Shareholders' Equity $ 105 381 1,776 82 $ 105 398 1,558 30 (695) $1.396 $3.163 $ 105 458 1,430 (47) (755) $1.191 $3.143 $ 105 455 1,622 (68) (761) $1,353 $3.369 (649) $1.695 $3.241 STATEMENT OF CASH FLOWS (in millions) Operations Net Income 2012 2011 2010 $ 196 146 28 (26) $ 75 184 $ 175 164 (52) 21 Depreciation & Amortization (Increase) Decrease Accounts Receivables (Increase) Decrease Inventories (Increase) Decrease Prepayments (Decrease) Increase Accounts Payable & Other Current Liabilities Net Addbacks and Subtractions from operations Cash flows from operations Investing Property Plant and Equipment acquired Other Investing Transactions Cash Flows from Investing 17 27 (21) 155 (90) (147) $ 195 23 112 $451 221 $480 ($79) (6) (S85) ($63) (2) ($65) ($59) (3) ($62) Financing Increase in Common Stock 0. (187) 309 Increase (Decrease) in Short-term Borrowing Increase (Decrease) in Long-term Borrowing Acquisition of Common Stock Dividends Other Financing Transactions Cash flow from Financing Change in Cash Cash - Beginning of Year Cash - End of Year (318) (384) (46) (37) 879 $94 $204 199 (170) (21) 243 ($311) $75 (6) (21) (250) ($151 $263 233 $ 496 421 $ 625 496 $421 Required: Use the spreadsheet below to provide your calculations and answers on the appropriate columns a. Calculate the amounts of these ratios for 2012. b. Assess the changes in the short-term liquidity risk of Techtron between 2010 and 2012 and the level of that risk at the end of 2012. c. Assess the changes in the long-term solvency risk of Techtron between 2010 and 2012 and the level of that risk at the end of 2012.
Expert Answer:
Answer rating: 100% (QA)
Revenues to cash ratio revenues average cash balances 2012 Total revenue 2500 Opening cash balance 421 closing cash balance 625 average cash balance 5... View the full answer

Related Book For 
Financial Accounting
ISBN: 978-1305088436
14th edition
Authors: Carl S. Warren, Jim Reeve, Jonathan Duchac
Posted Date:
Students also viewed these accounting questions
-
Financial statement data for the years ended December 31 for Blum Company are shown below. a. Determine the accounts receivable turnover for 2015 and 2014. Round to one decimal place. b. Determine...
-
Financial statement data for the years ended December 31 for Black Bull Inc. follows: ____________________________________________________2016_________________2015 Net...
-
Financial statement data for the years ended December 31 for Dovetail Corporation follow: _________________________________________ 20Y3 _______________ 20Y2 Net income...
-
4. What are the three categories of transactions in the balance of payments? Give an example of each. 5. Economists sometimes say that the current exchange rate system is a dirty float system. What...
-
If for some en > 0 with e n < ¥, it holds that P(| X n+1 X n | ³ e n ) < ¥, then show that X n to a r.v. It suffices to show that { X n } converges mutually a.s. To this end, set A n =...
-
Explain how conscious leadership can produce a conscious culture in the firm.
-
True or False: Broken rotor bars are just as easily identified at rest as during full-load operation of the motor.
-
Spiffy Shades Corporation manufactures artistic frames for sunglasses. Talia Demarest, controller, is responsible for preparing the company's master budget. In compiling the budget data for 20x1,...
-
Behavior Analysis/ABA. Briefly describe an intervention procedure using evidence-based approaches from the behavior analytic literature. FCT approach, and FERB and skill acquisition needed to...
-
John Parsons (123-45-6781) and George Smith (123-45-6782) are 70% and 30% owners, respectively, of Premium, Inc. (11-1111111), a candy company located at 1005 16th Street, Cut and Shoot, TX 77303....
-
There are 4 charts below, a. In each case, describe whether the investor is long or short the option? b. Label each strategy (example - call, put, call spread, put spread, straddle, strangle, collar,...
-
Employment law is made more complex because the federal government is not alone in regulating in this area -- all 50 states have their own employment laws. In the area of discrimination law in...
-
a= b= a= b= Consider the function f(z) = 5z + az + bz 2 where z = C, and a, b = R. If z - + is a solution to f(z) = 0, determine the values of a and b. QUESTION 2 Consider z, w = C where z = a cis...
-
Answer the following absorption costing questions: Question Which costs are included as product costs? Which costs are included as period costs? Absorption Costing
-
What primary source of United States law involves the previous decisions of courts to serve as precedent that provide guidance as to how the law has been interpreted in the past and the likelihood of...
-
Regarding association rule usage, consider the business uses and applications of this form of data mining. Select an industry such as finance, healthcare, environmental studies, or engineering and...
-
Solve the equation by the square root property. (z+7) = -64
-
What is taxable income, and what is the formula for determining taxable income?
-
The comparative balance sheet of Whitman Co. at December 31, 2016 and 2015, is as follows: The noncurrent asset, noncurrent liability, and stockholders' equity accounts for 2016 are as follows:...
-
Complete the following table by indicating for (a) through (g) whether the proper answer is debit or credit: Normal Decrease Balance Account Purchases Purchases Discounts Purchases Returns and...
-
Martin Farley and Ashley Clark formed a limited liability company with an operating agreement that provided a salary allowance of $40,000 and $30,000 to each member, respectively. In addition, the...
-
Suppose that a forward contract on an asset is written at time zero and there are \(M\) periods until delivery. Suppose that the proportional carrying charge in period \(k\) is \(q S(k)\), where...
-
Complete the second half of the proof of the "forward price formula with carrying cost". To construct the arbitrage, go long one unit of a forward and short one unit spot. To execute the short, it is...
-
A certain 10-year bond is currently selling for \(\$ 920\). A friend of yours owns a forward contract on this bond that has a delivery date in 1 year and a delivery price of \(\$ 940\). The bond pays...

Study smarter with the SolutionInn App