

Show results for case 1-3 by changing sales growth and price increase Year 1 $50,373,252.50 Year 2
Fantastic news! We've Found the answer you've been seeking!
Question:
Show results for case 1-3 by changing sales growth and price increase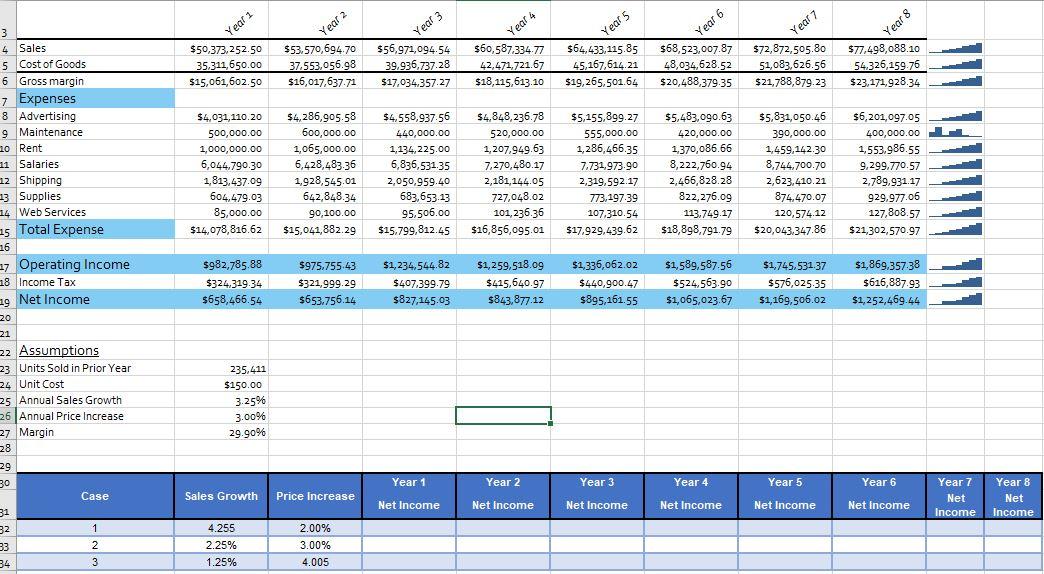
Transcribed Image Text:
Year 1 $50,373,252.50 Year 2 $53.570,694.70 Year 3 $56,971,094.54 Year 4 $60,587.334.77 42,471,721.67 $18,115,613.10 Year 5 $64,433,115.85 Year 6 $68,523,007.87 Year 7 $72,872,505.80 Year 8 $77,498,088.10 4 Sales 5 Cost of Goods 6 Gross margin 35,311,650.00 37.553,056.98 $16,017,637.71 39.936,737.28 $15,061,602.50 45,167,614.21 48,034,628.52 51,083,626.56 $17,034,357.27 54326,159.76 7 Expenses 8 Advertising s19,265,501.64 $20,488,379.35 $21,788,879.23 $23,171,928.34 $4,031,110.20 $4, 286,905.58 $4,558,937.56 $4,848,236.78 Maintenance $5,155,899.27 $5,483,090.63 $5,831,050.46 $6,201,097.05 500,000.00 600,000.00 440,000.00 10 Rent 11 Salaries 12 Shipping 13 Supplies 14 Web Services 15 Total Expense 16 17 Operating Income 18 Income Tax a9 Net Income 20 520,000.00 555,000.00 420,000.00 1,065,000.00 6,428,483.36 1,000,000.00 1,134,225.00 1,207,949.63 1,286,466.35 390,000.00 400,000.00 1,370,086.66 6,044.790.30 1,813.437.09 6,836, 531.35 7,270,480.17 1,459,142.30 1,553.986.55 1,928,545.01 7.731,973-90 8,222,760.94 8,744.700.70 2,050,959.40 2,181,144.05 2,319,592.17 2,466,828.28 9,299.770.57 604,479.03 2,623,410.21 2,789,931.17 929,977.06 642,848.34 683,653.13 727,048.02 85,000.00 773,197.39 822,276.09 874,470.07 90,100.00 95.506.00 101, 236.36 $16,856,095.01 107,310.54 $14,078,816.62 $15,041,882.29 $15.799,812.45 113,749.17 120,574.12 127,808.57 $17,929,439.62 $18,898,791.79 $20,043,347.86 $21,302,570.97 $982,785.88 $975.755.43 $1,234,544.82 $1,259,518.09 $1,336,062.02 $1,589,587.56 $324,319.34 $321,999.29 $407,399.79 $1,745,531.37 $1,869,357.38 $658,466.54 $415,640.97 $440,900.47 $524, 563.90 $653.756.14 $827,145.03 $576,025.35 $616,887.93 $843,877.12 $895,161.55 $1,065,023.67 $1,169,506.02 $1,252,469.44 21 22 Assumptions 23 Units Sold in Prior Year 24 Unit Cost 25 Annual Sales Growth 26 Annual Price Increase 27 Margin 28 235.411 $150.00 3.25% 3.00% 29.90% 29 30 Case Year 1 Year 2 Year 3 Sales Growth Price Increase Year 4 Year 5 31 Year 6 Year 7 Year 8 Net Income Net Income Net Income 32 Net Income Net Income Net Income Net Net 1 4.255 2.00% Income Income 33 2. 2.25% 3.00% 34 3 1.25% 4.005 Year 1 $50,373,252.50 Year 2 $53.570,694.70 Year 3 $56,971,094.54 Year 4 $60,587.334.77 42,471,721.67 $18,115,613.10 Year 5 $64,433,115.85 Year 6 $68,523,007.87 Year 7 $72,872,505.80 Year 8 $77,498,088.10 4 Sales 5 Cost of Goods 6 Gross margin 35,311,650.00 37.553,056.98 $16,017,637.71 39.936,737.28 $15,061,602.50 45,167,614.21 48,034,628.52 51,083,626.56 $17,034,357.27 54326,159.76 7 Expenses 8 Advertising s19,265,501.64 $20,488,379.35 $21,788,879.23 $23,171,928.34 $4,031,110.20 $4, 286,905.58 $4,558,937.56 $4,848,236.78 Maintenance $5,155,899.27 $5,483,090.63 $5,831,050.46 $6,201,097.05 500,000.00 600,000.00 440,000.00 10 Rent 11 Salaries 12 Shipping 13 Supplies 14 Web Services 15 Total Expense 16 17 Operating Income 18 Income Tax a9 Net Income 20 520,000.00 555,000.00 420,000.00 1,065,000.00 6,428,483.36 1,000,000.00 1,134,225.00 1,207,949.63 1,286,466.35 390,000.00 400,000.00 1,370,086.66 6,044.790.30 1,813.437.09 6,836, 531.35 7,270,480.17 1,459,142.30 1,553.986.55 1,928,545.01 7.731,973-90 8,222,760.94 8,744.700.70 2,050,959.40 2,181,144.05 2,319,592.17 2,466,828.28 9,299.770.57 604,479.03 2,623,410.21 2,789,931.17 929,977.06 642,848.34 683,653.13 727,048.02 85,000.00 773,197.39 822,276.09 874,470.07 90,100.00 95.506.00 101, 236.36 $16,856,095.01 107,310.54 $14,078,816.62 $15,041,882.29 $15.799,812.45 113,749.17 120,574.12 127,808.57 $17,929,439.62 $18,898,791.79 $20,043,347.86 $21,302,570.97 $982,785.88 $975.755.43 $1,234,544.82 $1,259,518.09 $1,336,062.02 $1,589,587.56 $324,319.34 $321,999.29 $407,399.79 $1,745,531.37 $1,869,357.38 $658,466.54 $415,640.97 $440,900.47 $524, 563.90 $653.756.14 $827,145.03 $576,025.35 $616,887.93 $843,877.12 $895,161.55 $1,065,023.67 $1,169,506.02 $1,252,469.44 21 22 Assumptions 23 Units Sold in Prior Year 24 Unit Cost 25 Annual Sales Growth 26 Annual Price Increase 27 Margin 28 235.411 $150.00 3.25% 3.00% 29.90% 29 30 Case Year 1 Year 2 Year 3 Sales Growth Price Increase Year 4 Year 5 31 Year 6 Year 7 Year 8 Net Income Net Income Net Income 32 Net Income Net Income Net Income Net Net 1 4.255 2.00% Income Income 33 2. 2.25% 3.00% 34 3 1.25% 4.005
Expert Answer:
Answer rating: 100% (QA)
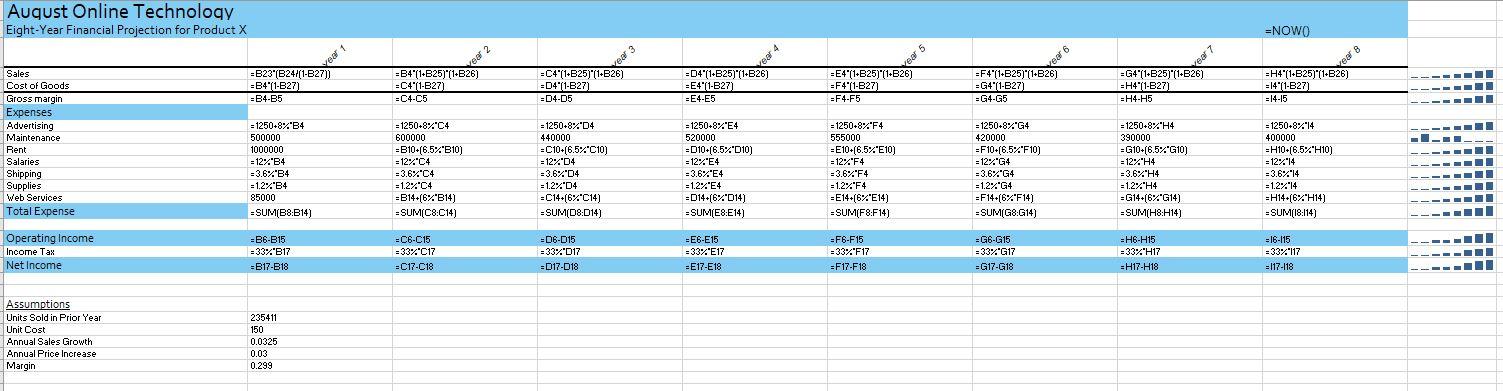
STEP 1 Create a Excel sheet as shown in the Question as below Year 1 Year 2 Year 3 Year 4 Year 5 Year 6 Year 7 Year 8 SALES 50373252 53570695 56971095 ... View the full answer

Posted Date:
Students also viewed these business writing questions
-
Cost of debt, iD 5.43% Corporate tax rate, TC 10.99% Total debt, D 57,104,000,000 Total equity, E 91,560,000,000 Total value of the firm, V 148,664,000,000 Beta, 0.61% Return on the market, iM 11%...
-
Jack purchased a share one year ago for $9.12, and it is now worth $11.86. The share paid a dividend of $1.74 during the year. What was the share's income rate of return during the year? (as a...
-
Show that the growth rate in an index futures price equals the excess return of the portfolio underlying the index over the risk-free rate. Assume that the risk-free interest rate and the dividend...
-
Compute the given derivatives with the help of formulas (1)(4). (a) (b) d dx (1) - x=e
-
Which should be more important to a shareholder of a company, cash flow or net income? Explain your answer.
-
Consider a simple pendulum with L = 1.2 m and m = 2.0 kg. Suppose the mass is initially at rest at the lowest point on its trajectory when it is given an impulse such that it then has a velocity of...
-
Organizational culture and climate are important aspects of the organization. Which of the following are characteristic of the culture of the organization? A. Supervisor support is given. B....
-
Chelsea Household Renovations (CHR) is a rapidly growing company that has not been profitable despite increases in sales. It has hired you as a consultant to find ways to improve profitability. You...
-
Question 3 (0.5 points) Babo company has a dividend yield of 4.50% and the cost of equity capital 16.00% respectivelly. If Babo's dividends will be expected to grow at a constant rate, what should be...
-
Go through the transaction list (Document1) and identify which cycle each transaction belongs to. A transaction will belong to only one cycle; either the Sale to Cash Receipt (S/CR) Cycle, Purchases...
-
Match the terms relating to the basic terminology and concepts of personal taxation on the left with the descriptions of the terms on the right. Read each description carefully and type the letter of...
-
To learn more about the real boat and the real conflict Bala's book is based off, The Boat People by Sharon Bala(stop at "The Nature of Things") and complete the following tool as you are reading....
-
[5] [5] 3. If g(x) = x = x sin (*) +16-x, find g'(2) 4. Consider the function: f(x)=ax+b. x-1 -1
-
Define the types of budgets in healthcare organizations ( Capital , operating, cash ) . Describe what costs are covered in each of these specific budget types related to the definition. Please...
-
Receive 10 annual payments of $1,000; the first payment of $1,000 is made in one year (t=1). Plus receive one "balloon" payment of $25,000 in ten years (t=10). If the interest rate is 15% (EAR), what...
-
Explain theories and models which examine organisational culture and human behaviour? You MUST provide an explanation of one theory or model which examines organisational culture., i.e. Schein,...
-
NUMBER ONE Baru Ltd., publishing and printing company, extracted the following trial balance as at 31 October 2005: Property, plant and equipment: Cost depreciation Intangible assets Inventory...
-
Why do markets typically lead to an efficient outcome for buyers and sellers?
-
Bowen Corporation has the following shares outstanding: 15,000 shares of \(\$ 50\) par value, six percent preferred stock and 50,000 shares of \(\$ 5\) par value common stock. During its first three...
-
High Corporation has 60,000 shares of \(\$ 20\) par value common stock outstanding and retained earnings of \(\$ 800,000\). The company declares a 100 percent stock dividend. The market price at the...
-
Lester Corporation has 30,000 shares of \(\$ 1\) par value common stock outstanding. The company has \(\$ 250,000\) of retained earnings. At year-end, the company declares a cash dividend of \(\$...

Study smarter with the SolutionInn App