

Since you will not have a computer to use on exams, it is also important to...
Fantastic news! We've Found the answer you've been seeking!
Question:
Transcribed Image Text:
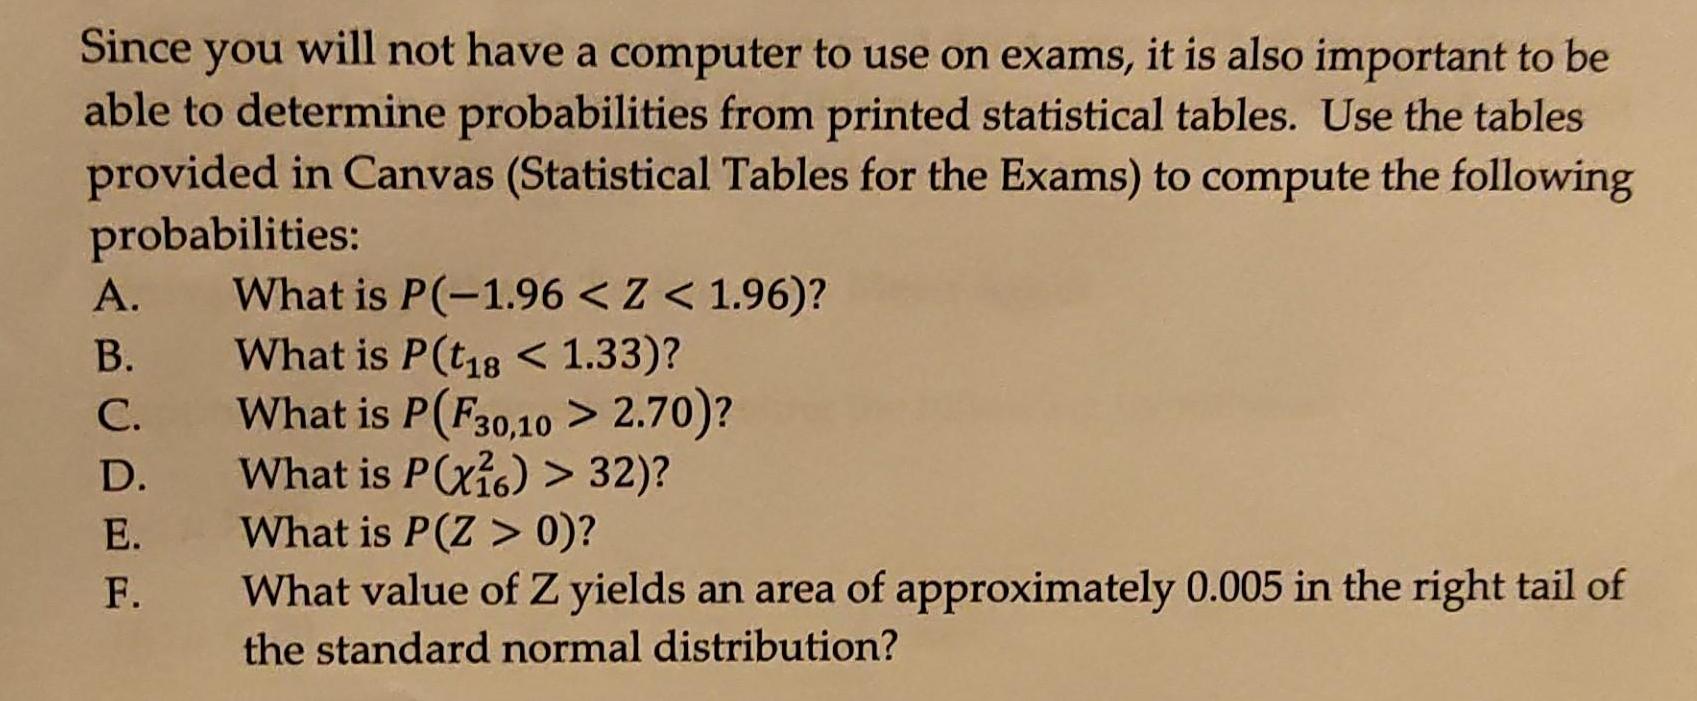
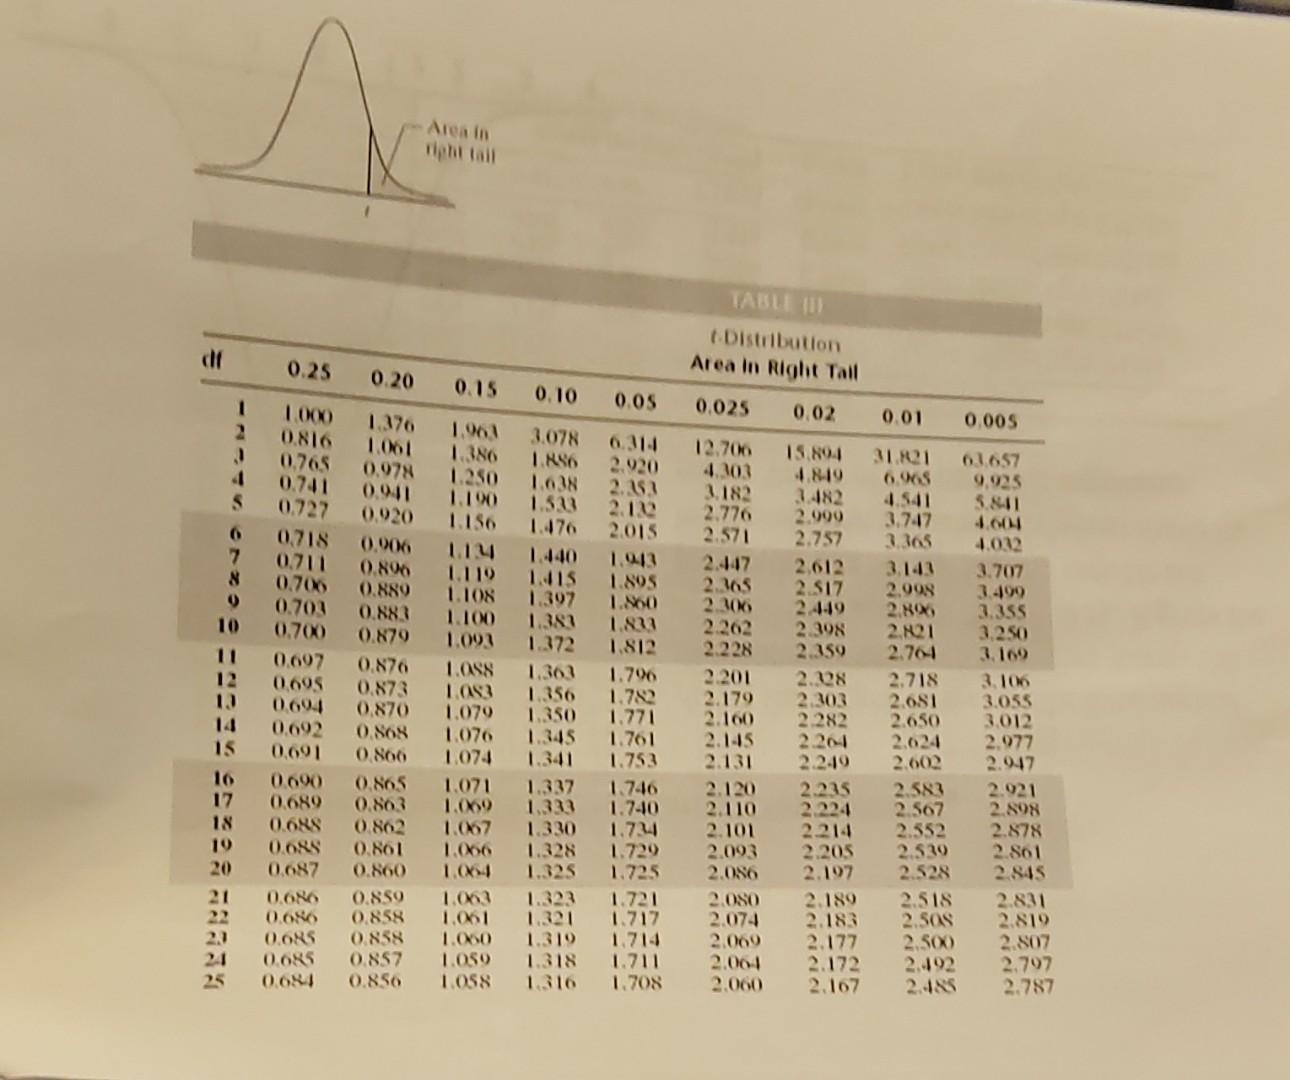
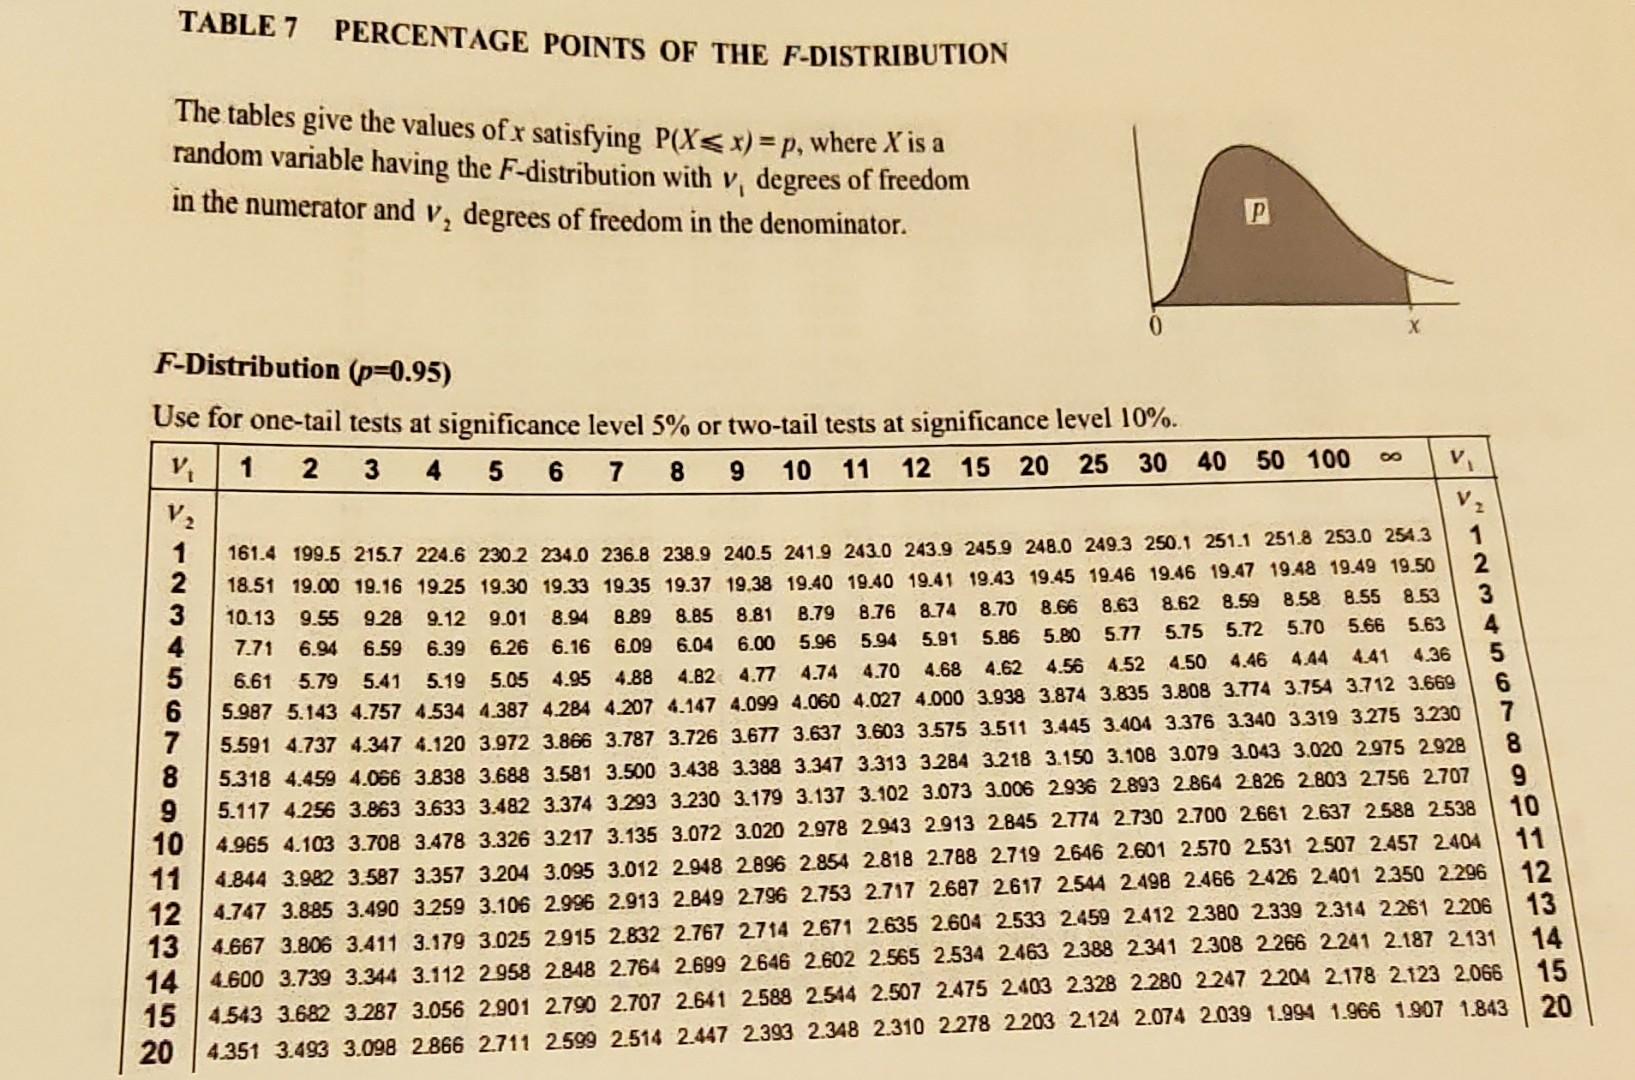
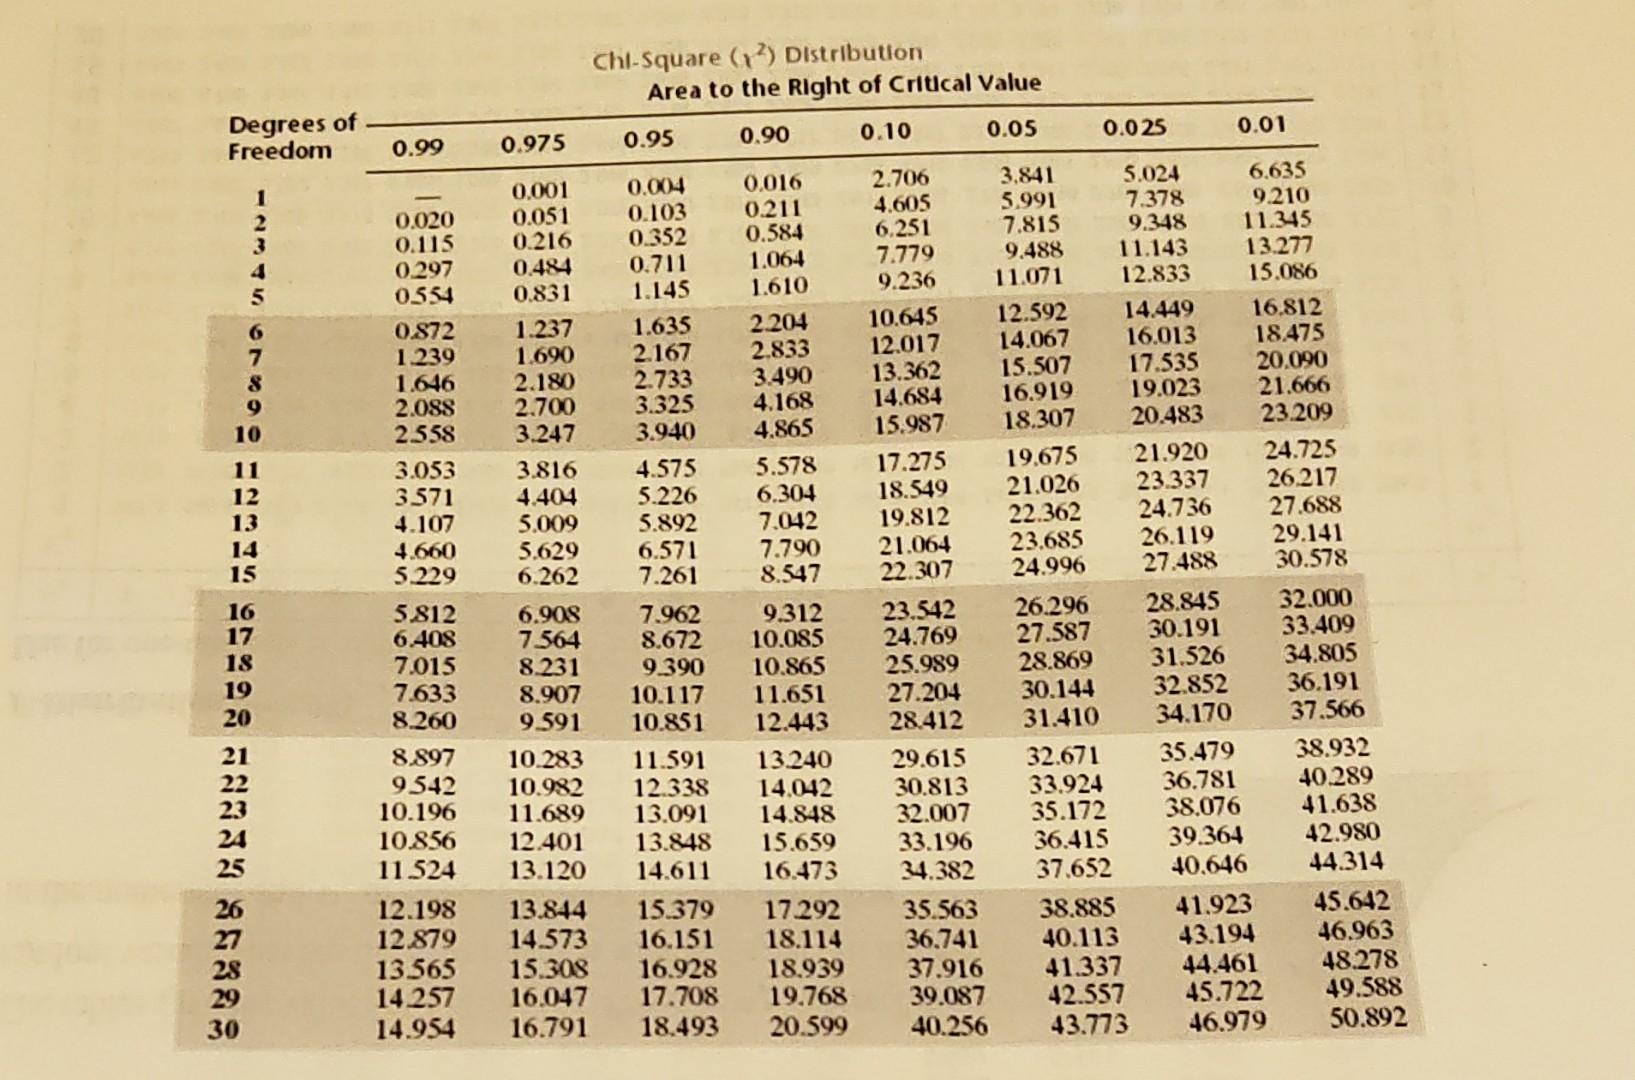
Since you will not have a computer to use on exams, it is also important to be able to determine probabilities from printed statistical tables. Use the tables provided in Canvas (Statistical Tables for the Exams) to compute the following probabilities: What is P(-1.96 < Z < 1.96)? What is P(t18 < 1.33)? What is P(F30,10> 2.70)? A. B. C. D. E. F. What value of Z yields an area of approximately 0.005 in the right tail of the standard normal distribution? What is P(x) > 32)? What is P(Z > 0)? dif 6 7 8 9 10 12 15 16 17 18 19 20 23 24 25 0.25 0.20 0.15 0.10 0.05 1 1.000 1.376 1.963 3.078 6.314 2 0.816 1.061 1.386 1.886 2.920 30.765 0.978 1.250 1.638 2.353 4 0.741 0.941 1.190 1.533 2.132 0.727 0.920 1.156 1.476 2.015 S 0,718 0.906 0.711 0.896 0.706 0.889 Area in 1.134 1.440 1.119 1.415 1.943 1.895 1.108 1.397 1.860 1.100 1.383 1.833 1.093 1.372 1.812 0.697 0.876 1.088 1.363 1.796 0,695 0.873 1.083 1.356 1.782 0.694 0.870 1.079 1.350 1.771 0.692 0.868 1.076 1.345 1.761 0,691 0.866 1.074 1.341 1.753 1.071 1.337 1.746 1.069 1.333 1.740 1.067 1.330 1.734 1.066 1.328 1.729 1.064 1.325 1.725 0.703 0.883 0.700 0.879 0.690 0.865 0.688 0.689 0.863 0.688 0.862 0.861 0.687 0.860 0.686 0.859 1.063 1.323 1.721 0.686 0.858 1.061 1.321 1.717 0.685 0.858 1.060 1.319 1,714 0.685 0.857 1.059 1.318 1.711 0.684 0.856 1.058 1.316 1.708 TABLE -Distribution Area in Right Tail 0.025 0.02 12.706 15,894 31.821 4.303 4.849 3.182 3.482 2.776 2.999 2.571 2.757 2,612 2.447 2.365 2.517 2.306 2.449 2.398 2.359 2.262 2.228 2.201 2.179 2.160 0.01 0.005 63.657 9,925 5.841 4.604 4.032 2.303 2.282 6.968 4.541 3.747 3.365 2.998 2.896 2.821 2.764 2.328 2.718 3.106 3.055 3.012 2.977 2.947 2.681 2.650 2.624 2.602 2.145 2.264 2.131 2.249 2.120 2.110 2.224 2.101 2214 2.093 2.205 2.197 2.189 2.518 2.086 2.080 2.074 2.183 2.508 2.069 2.177 2.500 2.172 2.492 2.064 2.060 2.167 2.485 3.707 3.499 3.355 3,250 2.235 2.583 2.567 2.552 2.539 2.528 2.921 2.898 2.878 2.861 2.845 2.831 2.819 2.807 2.797 2.787 TABLE 7 PERCENTAGE POINTS OF THE F-DISTRIBUTION The tables give the values of x satisfying P(X< x) = p, where X is a random variable having the F-distribution with v, degrees of freedom in the numerator and v₂ degrees of freedom in the denominator. P F-Distribution (p=0.95) Use for one-tail tests at significance level 5% or two-tail tests at significance level 10%. V₁ 1 2 3 4 5 6 7 8 9 10 11 12 15 20 25 30 40 50 100 V₂ 1 V₂ 1234567 8.70 8.74 5.86 5.91 4.68 4.62 5.80 5.77 5.75 5.72 8.58 8.55 8.53 5.63 5.70 5.66 4.46 4.44 4.41 4.36 7 8 161.4 199.5 215.7 224.6 230.2 234.0 236.8 238.9 240.5 241.9 243.0 243.9 245.9 248.0 249.3 250.1 251.1 251.8 253.0 254.3 18.51 19.00 19.16 19.25 19.30 19.33 19.35 19.37 19.38 19.40 19.40 19.41 19.43 19.45 19.46 19.46 19.47 1948 1949 19.50 8.66 8.63 8.62 8.59 10.13 9.55 9.28 9.12 9.01 8.94 8.89 8.85 8.81 8.79 8.76 7.71 6.94 6.59 6.39 6.26 6.16 6.09 6.04 6.00 5.96 5.94 4.56 4.52 4.50 6.61 4.74 4.70 5.79 5.41 5.19 5.05 4.95 4.88 4.82 4.77 5.987 5.143 4.757 4.534 4.387 4.284 4.207 4.147 4.099 4.060 4.027 4.000 3.938 3.874 3.835 3.808 3.774 3.754 3.712 3.669 5.591 4.737 4.347 4.120 3.972 3.866 3.787 3.726 3.677 3.637 3.603 3.575 3.511 3.445 3.404 3.376 3.340 3.319 3.275 3.230 5.318 4.459 4.066 3.838 3.688 3.581 3.500 3.438 3.388 3.347 3.313 3.284 3.218 3.150 3.108 3.079 3.043 3.020 2.975 2.928 9 5.117 4.256 3.863 3.633 3.482 3.374 3.293 3.230 3.179 3.137 3.102 3.073 3.006 2.936 2.893 2.864 2.826 2.803 2.756 2.707 10 4.965 4.103 3.708 3.478 3.326 3.217 3.135 3.072 3.020 2.978 2.943 2.913 2845 2774 2.730 2.700 2.661 2.637 2.588 2.538 11 4.844 3.982 3.587 3.357 3.204 3.095 3.012 2.948 2896 2.854 2.818 2.788 2719 2.646 2.601 2.570 2.531 2.507 2.457 2.404 12 4.747 3.885 3.490 3.259 3.106 2.996 2.913 2.849 2.796 2.753 2.717 2.687 2617 2.544 2.498 2.466 2426 2.401 2.350 2.296 13 4.667 3.806 3.411 3.179 3.025 2.915 2.832 2.767 2714 2.671 2.635 2.604 2.533 2.459 2.412 2.380 2.339 2.314 2.261 2.206 14 4.600 3.739 3.344 3.112 2.958 2848 2.764 2.699 2.646 2.602 2.565 2.534 2463 2.388 2.341 2.308 2.266 2.241 2.187 2131 15 4.543 3.682 3.287 3.056 2.901 2.790 2.707 2.641 2588 2.544 2.507 2.475 2403 2.328 2.280 2247 2204 2.178 2.123 2.066 20 4.351 3.493 3.098 2.866 2.711 2599 2.514 2.447 2393 2.348 2.310 2.278 2.203 2124 2.074 2.039 1.994 1.966 1.907 1.843 3 9 10 11 12 13 14 15 20 Degrees of Freedom 8 9 10 11 12 13 14 15 16 17 18 19 20 21 22 23 24 25 26 27 28 29 30 0.99 0.020 0.115 0.297 0554 0.872 1.239 1.646 2.088 2.558 3.053 3571 4.107 4.660 5.229 5.812 6.408 7.015 7.633 8.260 0.975 0,001 0.051 0.216 Chl-Square (2) Distribution 1.237 1.690 2.180 2.700 3.247 Area to the Right of Critical Value 0.90 0.05 0.95 0.004 0.103 0.352 0.484 0.711 0.831 1.145 0.016 0.211 0.584 1.064 1.610 1.635 2204 2.167 2.833 2.733 3.490 3.325 4.168 3.940 4.865 3.816 4.575 5.578 4.404 5.226 6.304 5.009 5.892 7.042 5.629 6.571 7.790 6.262 7.261 8.547 9.312 10.085 10.865 6.908 7.962 7.564 8.672 8.231 9.390 8.907 10.117 11.651 9.591 10.851 12.443 0.10 2.706 4.605 6.251 7.779 9.236 10.645 12.017 13.362 14.684 15.987 17.275 18.549 19.812 21.064 22.307 23.542 24.769 25.989 27.204 28.412 11.591 13.240 12.338 14.042 8.897 10.283 9542 10.982 10.196 11.689 13.091 14.848 10.856 12.401 13.848 15.659 11.524 13.120 14.611 16.473 12.198 13.844 15.379 17.292 35.563 12.879 14.573 16.151 18.114 13.565 15.308 16.928 18.939 14.257 16.047 17.708 19.768 14.954 16.791 18.493 20.599 36.741 37.916 39.087 40.256 29.615 30.813 32.007 33.196 34.382 3.841 5.991 7.815 9.488 11.071 19,675 21.026 12.592 14.449 14.067 15.507 16.919 18.307 22.362 23.685 24.996 0.025 26.296 27.587 28.869 30.144 31.410 5.024 7.378 9.348 11.143 12.833 32.671 33.924 35.172 36.415 37.652 16.013 17.535 19.023 20.483 38.885 40.113 21.920 23.337 24.736 26.119 27.488 28.845 30.191 31.526 32.852 34.170 0.01 6.635 9.210 11.345 13.277 15.086 35.479 36.781 38.076 39.364 40.646 16.812 18.475 20.090 21.666 23.209 41.923 43.194 41.337 44.461 42.557 45.722 43.773 46.979 24.725 26.217 27.688 29.141 30.578 32.000 33.409 34.805 36.191 37.566 38.932 40.289 41.638 42.980 44.314 45.642 46.963 48.278 49.588 50.892 Since you will not have a computer to use on exams, it is also important to be able to determine probabilities from printed statistical tables. Use the tables provided in Canvas (Statistical Tables for the Exams) to compute the following probabilities: What is P(-1.96 < Z < 1.96)? What is P(t18 < 1.33)? What is P(F30,10> 2.70)? A. B. C. D. E. F. What value of Z yields an area of approximately 0.005 in the right tail of the standard normal distribution? What is P(x) > 32)? What is P(Z > 0)? dif 6 7 8 9 10 12 15 16 17 18 19 20 23 24 25 0.25 0.20 0.15 0.10 0.05 1 1.000 1.376 1.963 3.078 6.314 2 0.816 1.061 1.386 1.886 2.920 30.765 0.978 1.250 1.638 2.353 4 0.741 0.941 1.190 1.533 2.132 0.727 0.920 1.156 1.476 2.015 S 0,718 0.906 0.711 0.896 0.706 0.889 Area in 1.134 1.440 1.119 1.415 1.943 1.895 1.108 1.397 1.860 1.100 1.383 1.833 1.093 1.372 1.812 0.697 0.876 1.088 1.363 1.796 0,695 0.873 1.083 1.356 1.782 0.694 0.870 1.079 1.350 1.771 0.692 0.868 1.076 1.345 1.761 0,691 0.866 1.074 1.341 1.753 1.071 1.337 1.746 1.069 1.333 1.740 1.067 1.330 1.734 1.066 1.328 1.729 1.064 1.325 1.725 0.703 0.883 0.700 0.879 0.690 0.865 0.688 0.689 0.863 0.688 0.862 0.861 0.687 0.860 0.686 0.859 1.063 1.323 1.721 0.686 0.858 1.061 1.321 1.717 0.685 0.858 1.060 1.319 1,714 0.685 0.857 1.059 1.318 1.711 0.684 0.856 1.058 1.316 1.708 TABLE -Distribution Area in Right Tail 0.025 0.02 12.706 15,894 31.821 4.303 4.849 3.182 3.482 2.776 2.999 2.571 2.757 2,612 2.447 2.365 2.517 2.306 2.449 2.398 2.359 2.262 2.228 2.201 2.179 2.160 0.01 0.005 63.657 9,925 5.841 4.604 4.032 2.303 2.282 6.968 4.541 3.747 3.365 2.998 2.896 2.821 2.764 2.328 2.718 3.106 3.055 3.012 2.977 2.947 2.681 2.650 2.624 2.602 2.145 2.264 2.131 2.249 2.120 2.110 2.224 2.101 2214 2.093 2.205 2.197 2.189 2.518 2.086 2.080 2.074 2.183 2.508 2.069 2.177 2.500 2.172 2.492 2.064 2.060 2.167 2.485 3.707 3.499 3.355 3,250 2.235 2.583 2.567 2.552 2.539 2.528 2.921 2.898 2.878 2.861 2.845 2.831 2.819 2.807 2.797 2.787 TABLE 7 PERCENTAGE POINTS OF THE F-DISTRIBUTION The tables give the values of x satisfying P(X< x) = p, where X is a random variable having the F-distribution with v, degrees of freedom in the numerator and v₂ degrees of freedom in the denominator. P F-Distribution (p=0.95) Use for one-tail tests at significance level 5% or two-tail tests at significance level 10%. V₁ 1 2 3 4 5 6 7 8 9 10 11 12 15 20 25 30 40 50 100 V₂ 1 V₂ 1234567 8.70 8.74 5.86 5.91 4.68 4.62 5.80 5.77 5.75 5.72 8.58 8.55 8.53 5.63 5.70 5.66 4.46 4.44 4.41 4.36 7 8 161.4 199.5 215.7 224.6 230.2 234.0 236.8 238.9 240.5 241.9 243.0 243.9 245.9 248.0 249.3 250.1 251.1 251.8 253.0 254.3 18.51 19.00 19.16 19.25 19.30 19.33 19.35 19.37 19.38 19.40 19.40 19.41 19.43 19.45 19.46 19.46 19.47 1948 1949 19.50 8.66 8.63 8.62 8.59 10.13 9.55 9.28 9.12 9.01 8.94 8.89 8.85 8.81 8.79 8.76 7.71 6.94 6.59 6.39 6.26 6.16 6.09 6.04 6.00 5.96 5.94 4.56 4.52 4.50 6.61 4.74 4.70 5.79 5.41 5.19 5.05 4.95 4.88 4.82 4.77 5.987 5.143 4.757 4.534 4.387 4.284 4.207 4.147 4.099 4.060 4.027 4.000 3.938 3.874 3.835 3.808 3.774 3.754 3.712 3.669 5.591 4.737 4.347 4.120 3.972 3.866 3.787 3.726 3.677 3.637 3.603 3.575 3.511 3.445 3.404 3.376 3.340 3.319 3.275 3.230 5.318 4.459 4.066 3.838 3.688 3.581 3.500 3.438 3.388 3.347 3.313 3.284 3.218 3.150 3.108 3.079 3.043 3.020 2.975 2.928 9 5.117 4.256 3.863 3.633 3.482 3.374 3.293 3.230 3.179 3.137 3.102 3.073 3.006 2.936 2.893 2.864 2.826 2.803 2.756 2.707 10 4.965 4.103 3.708 3.478 3.326 3.217 3.135 3.072 3.020 2.978 2.943 2.913 2845 2774 2.730 2.700 2.661 2.637 2.588 2.538 11 4.844 3.982 3.587 3.357 3.204 3.095 3.012 2.948 2896 2.854 2.818 2.788 2719 2.646 2.601 2.570 2.531 2.507 2.457 2.404 12 4.747 3.885 3.490 3.259 3.106 2.996 2.913 2.849 2.796 2.753 2.717 2.687 2617 2.544 2.498 2.466 2426 2.401 2.350 2.296 13 4.667 3.806 3.411 3.179 3.025 2.915 2.832 2.767 2714 2.671 2.635 2.604 2.533 2.459 2.412 2.380 2.339 2.314 2.261 2.206 14 4.600 3.739 3.344 3.112 2.958 2848 2.764 2.699 2.646 2.602 2.565 2.534 2463 2.388 2.341 2.308 2.266 2.241 2.187 2131 15 4.543 3.682 3.287 3.056 2.901 2.790 2.707 2.641 2588 2.544 2.507 2.475 2403 2.328 2.280 2247 2204 2.178 2.123 2.066 20 4.351 3.493 3.098 2.866 2.711 2599 2.514 2.447 2393 2.348 2.310 2.278 2.203 2124 2.074 2.039 1.994 1.966 1.907 1.843 3 9 10 11 12 13 14 15 20 Degrees of Freedom 8 9 10 11 12 13 14 15 16 17 18 19 20 21 22 23 24 25 26 27 28 29 30 0.99 0.020 0.115 0.297 0554 0.872 1.239 1.646 2.088 2.558 3.053 3571 4.107 4.660 5.229 5.812 6.408 7.015 7.633 8.260 0.975 0,001 0.051 0.216 Chl-Square (2) Distribution 1.237 1.690 2.180 2.700 3.247 Area to the Right of Critical Value 0.90 0.05 0.95 0.004 0.103 0.352 0.484 0.711 0.831 1.145 0.016 0.211 0.584 1.064 1.610 1.635 2204 2.167 2.833 2.733 3.490 3.325 4.168 3.940 4.865 3.816 4.575 5.578 4.404 5.226 6.304 5.009 5.892 7.042 5.629 6.571 7.790 6.262 7.261 8.547 9.312 10.085 10.865 6.908 7.962 7.564 8.672 8.231 9.390 8.907 10.117 11.651 9.591 10.851 12.443 0.10 2.706 4.605 6.251 7.779 9.236 10.645 12.017 13.362 14.684 15.987 17.275 18.549 19.812 21.064 22.307 23.542 24.769 25.989 27.204 28.412 11.591 13.240 12.338 14.042 8.897 10.283 9542 10.982 10.196 11.689 13.091 14.848 10.856 12.401 13.848 15.659 11.524 13.120 14.611 16.473 12.198 13.844 15.379 17.292 35.563 12.879 14.573 16.151 18.114 13.565 15.308 16.928 18.939 14.257 16.047 17.708 19.768 14.954 16.791 18.493 20.599 36.741 37.916 39.087 40.256 29.615 30.813 32.007 33.196 34.382 3.841 5.991 7.815 9.488 11.071 19,675 21.026 12.592 14.449 14.067 15.507 16.919 18.307 22.362 23.685 24.996 0.025 26.296 27.587 28.869 30.144 31.410 5.024 7.378 9.348 11.143 12.833 32.671 33.924 35.172 36.415 37.652 16.013 17.535 19.023 20.483 38.885 40.113 21.920 23.337 24.736 26.119 27.488 28.845 30.191 31.526 32.852 34.170 0.01 6.635 9.210 11.345 13.277 15.086 35.479 36.781 38.076 39.364 40.646 16.812 18.475 20.090 21.666 23.209 41.923 43.194 41.337 44.461 42.557 45.722 43.773 46.979 24.725 26.217 27.688 29.141 30.578 32.000 33.409 34.805 36.191 37.566 38.932 40.289 41.638 42.980 44.314 45.642 46.963 48.278 49.588 50.892
Expert Answer:

Related Book For 

Management Accounting Information for Decision-Making and Strategy Execution
ISBN: 978-0137024971
6th Edition
Authors: Anthony A. Atkinson, Robert S. Kaplan, Ella Mae Matsumura, S. Mark Young
Posted Date:
Students also viewed these economics questions
-
Case Study: Quick Fix Dental Practice Technology requirements Application must be built using Visual Studio 2019 or Visual Studio 2017, professional or enterprise. The community edition is not...
-
The site http://virtualpiano.net features an online player piano. If you click on the Key Assist menu just above the piano keyboard, and then Keyboard Keys, you will see that each key is labelled...
-
1. Hannah is applying for a life policy on her girlfriend Sarahs life. The policy is $500,000 and carries a large premium. Hannah is the main earner, so she is concerned about not being able to pay...
-
For rigid-body motion, the strains will vanish. Under these conditions, integrate the straindisplacement relations (7.6.1) to show that the most general form of a rigid-body motion displacement field...
-
A glass rod 96 cm long with an index of refraction of 1.6 has its ends ground to convex spherical surfaces of radii 8 cm and 16 cm. A point object is in air on the axis of the rod 20 cm from the end...
-
On March 16, 2020, the stock market fell almost 13%. How can we reconcile these kinds of huge losses in the stock market with the efficient market hypothesis?
-
A person donates a bag of clothes to Goodwill completely unaware that there is valuable sterling silver in the bag. The clothing and silver are subsequently sold, for a very economical price, to...
-
The following table details the tasks required for Indiana- based Frank Pianki Industries to manufacture a fully portable industrial vacuum cleaner. The times in the table are in minutes. Demand...
-
explain diagram of ER model and relational model and attach their diagrams too Each cinema is identified by its name and has its residency at an address which consists of a street and city only....
-
The Triad family of mutual funds allows investors to split their money between three portfolios managed by Triad. Portfolio C has an expected return of E[R] 10% and a standard deviation of returns of...
-
A Canadian firm bought textiles for 100,000 from Italy, payable in one year. And the firm is concerned about the amount of dollars they will have to pay for this purchase. Based on the quotes listed...
-
If F1 = 50, F2 = 30, d1 = 5, d2 = 3. If we replace the force-couple system at A with a single equivalent force, what its location? a. 4.92 O b. 6.51 O c. 5.34 O d. 6.13 A d F1 F2 B d2 C Time le
-
To complete this task, you must: Update and finalise the marketing communication plan according to feedback received from stakeholders in Workplace Project Task 5 Outline the modifications done in...
-
To impartially improve the quality of life means: a. don't worry about it b. don't just partially improve the quality of life c. determine which quality issues should be addressed first; i.e....
-
A firm has a capital structure with $120 million in equity and $50 million of debt. The expected return on its equity is 6.70%, and the firm has 4.30% Yield-to-Maturity on its debt. If the marginal...
-
Explain the journey of consumer framework for Fandelo including every step based on this photo. CUSTOMER VALUE JOURNEY CANVAS G ASCEND ADVOCATE PROMOTE ($) EXCITE CONVERT AWARE ENGAGE SUBSCRIBE
-
State Age 0-20 Age 21-34 Age 35-54 Age 55+ All Ages Male Female Alabama 8.6 20.8 12.6 15.5 13.7 17.6 10 Alaska 5.4 5.5 Arizona 5 12 7.3 6.9 7.4 10.2 4.7 Arkansas 8 20.3 13.8 16.2 13.8 17.3 10.4...
-
-4 1 9. Let A = Find A-1, (A") and verify that (A")= (A-1)".
-
Compute activity-based cost rate, time equations CAN Company sells multiple products and uses a time-driven ABC system. The companys products must be wrapped individually before shipping. The...
-
What are three reasons financial control alone may provide an ineffective control scorecard?
-
Why do companies producing a varied and complex mix of products have higher costs than companies producing only a narrow range of products?
-
What are five characteristics of good audience benefits?
-
Why might you choose a phone call, an email, a memo, a text message, or a particular social media for a given business message?
-
The Acme Corporation has been planning to acquire Best Products, and Acme employees are worried about how the acquisition will affect them. Ed Zeplin, Acmes human resource manager, has been visiting...

Study smarter with the SolutionInn App