

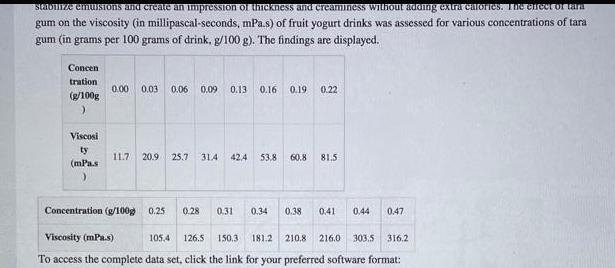
stabilize emulsions and create an impression of thickness and creaminess without adding extra calories. The effect...
Fantastic news! We've Found the answer you've been seeking!
Question:

Expert Answer:
Solution a Create a scatterplot of the data using the software of your choice To yo... View the full answer

Related Book For 
John E Freunds Mathematical Statistics with Applications
ISBN: 978-0134995373
8th edition
Authors: Irwin Miller, Marylees Miller
Posted Date:
