

Statistics: Statistics: Multiple Linear Regression Please Solve problem. Page 1 of 4 Enterprise Industries produces Fresh,...
Fantastic news! We've Found the answer you've been seeking!
Question:
Transcribed Image Text:
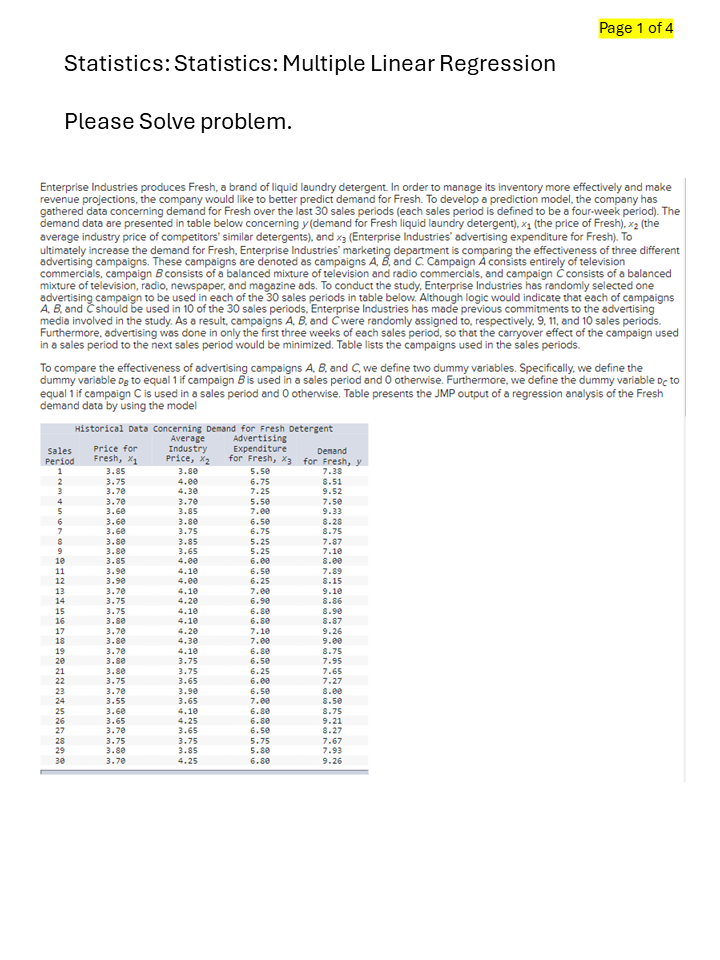
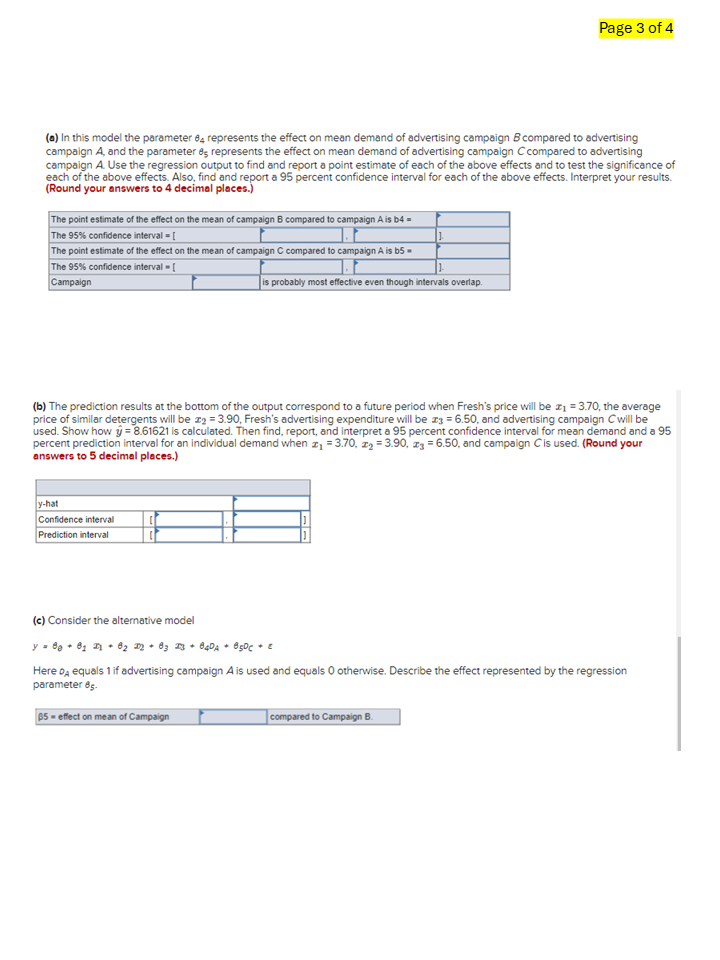
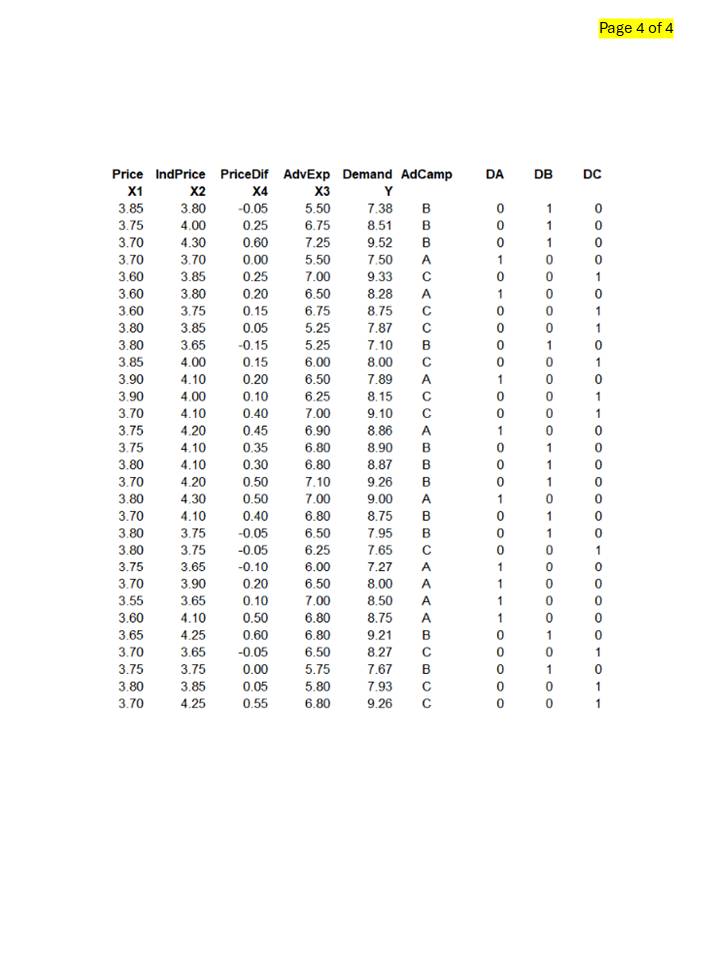
Statistics: Statistics: Multiple Linear Regression Please Solve problem. Page 1 of 4 Enterprise Industries produces Fresh, a brand of liquid laundry detergent. In order to manage its inventory more effectively and make revenue projections, the company would like to better predict demand for Fresh. To develop a prediction model, the company has gathered data concerning demand for Fresh over the last 30 sales periods (each sales period is defined to be a four-week period). The demand data are presented in table below concerning y (demand for Fresh liquid laundry detergent), x (the price of Fresh), x2 (the average industry price of competitors' similar detergents), and x3 (Enterprise Industries' advertising expenditure for Fresh). To ultimately increase the demand for Fresh, Enterprise Industries' marketing department is comparing the effectiveness of three different advertising campaigns. These campaigns are denoted as campaigns A, B, and C. Campaign A consists entirely of television commercials, campaign B consists of a balanced mixture of television and radio commercials, and campaign consists of a balanced mixture of television, radio, newspaper, and magazine ads. To conduct the study, Enterprise Industries has randomly selected one advertising campaign to be used in each of the 30 sales periods in table below. Although logic would indicate that each of campaigns A, B, and C should be used in 10 of the 30 sales periods, Enterprise Industries has made previous commitments to the advertising media involved in the study. As a result, campaigns A, B, and Cwere randomly assigned to, respectively, 9, 11, and 10 sales periods. Furthermore, advertising was done in only the first three weeks of each sales period, so that the carryover effect of the campaign used in a sales period to the next sales period would be minimized. Table lists the campaigns used in the sales periods. To compare the effectiveness of advertising campaigns A, B, and C, we define two dummy variables. Specifically, we define the dummy variable og to equal 1 if campaign Bis used in a sales period and 0 otherwise. Furthermore, we define the dummy variable De to equal 1 if campaign C is used in a sales period and 0 otherwise. Table presents the JMP output of a regression analysis of the Fresh demand data by using the model Historical Data Concerning Demand for Fresh Detergent Sales Period Price for Average Industry Advertising Expenditure Fresh, x1 1 3.85 Price, x2 for Fresh, x3 for Fresh, y Demand 3.80 5.50 7.38 2 3.75 4.00 6.75 8.51 3 3.70 4.30 7.25 9.52 4 3.70 3.70 5.50 7.50 3.60 3.85 7.00 9.33 6 3.60 3.80 6.50 8.28 7 3.60 3.75 6.75 8.75 8 3.80 3.85 5.25 7.87 9 3.80 3.65 5.25 7.10 10 3.85 4.00 6.00 8.00 11 3.90 4.10 6.50 7.89 12 3.90 4.00 6.25 8.15 13 3.70 4.10 7.00 9.10 14 3.75 4.20 6.90 8.86 15 3.75 4.10 6.80 8.90 16 3.80 4.10 6.80 8.87 17 3.70 4.20 7.10 9.26 18 3.80 4.30 7.00 9.00 19 3.70 4.10 6.80 8.75 20 3.80 3.75 6.50 7.95 21 3.80 3.75 6.25 7.65 22 3.75 3.65 6.00 7.27 23 3.70 3.90 6.50 8.00 24 3.55 3.65 7.00 8.50 25 3.60 4.10 6.80 8.75 26 3.65 4.25 6.80 9.21 27 3.70 3.65 6.50 8.27 28 3.75 3.75 5.75 7.67 29 3.80 3.85 5.80 7.93 30 3.70 4.25 6.80 9.26 Page 3 of 4 (a) In this model the parameter 84 represents the effect on mean demand of advertising campaign B compared to advertising campaign A, and the parameter es represents the effect on mean demand of advertising campaign C compared to advertising campaign A. Use the regression output to find and report a point estimate of each of the above effects and to test the significance of each of the above effects. Also, find and report a 95 percent confidence interval for each of the above effects. Interpret your results. (Round your answers to 4 decimal places.) The point estimate of the effect on the mean of campaign B compared to campaign A is b4 = The 95% confidence interval=[ The point estimate of the effect on the mean of campaign C compared to campaign A is b5 - The 95% confidence interval = [ Campaign is probably most effective even though intervals overlap. (b) The prediction results at the bottom of the output correspond to a future period when Fresh's price will be z = 3.70, the average price of similar detergents will be 2 = 3.90, Fresh's advertising expenditure will be x3 = 6.50, and advertising campaign C will be used. Show how = 8.61621 is calculated. Then find, report, and interpret a 95 percent confidence interval for mean demand and a 95 percent prediction interval for an individual demand when z = 3.70, x2 = 3.90, x3 = 6.50, and campaign C is used. (Round your answers to 5 decimal places.) y-hat Confidence interval Prediction interval (c) Consider the alternative model y= 6 +61 +62 2 + 83 23 84DA +85C + Here D equals 1 if advertising campaign A is used and equals 0 otherwise. Describe the effect represented by the regression parameter 65. B5-effect on mean of Campaign compared to Campaign B. Price IndPrice PriceDif AdvExp Demand AdCamp DA DB DC X1 X2 X4 X3 Y 3.85 3.80 -0.05 5.50 7.38 3.75 4.00 0.25 6.75 8.51 3.70 4.30 0.60 7.25 9.52 3.70 3.70 0.00 5.50 7.50 3.60 3.85 0.25 7.00 9.33 3.60 3.80 0.20 6.50 8.28 3.60 3.75 0.15 6.75 8.75 3.80 3.85 0.05 5.25 7.87 3.80 3.65 -0.15 5.25 7.10 BBBACACOB 11 1000 0 0 1 0 0 0 0 1 1 0 1 0 3.85 4.00 0.15 6.00 8.00 C 0 0 1 3.90 4.10 0.20 6.50 7.89 A 1 0 0 3.90 4.00 0.10 6.25 8.15 3.70 4.10 0.40 7.00 9.10 00 0 1 0 0 1 3.75 4.20 0.45 6.90 8.86 A 3.75 4.10 0.35 6.80 8.90 B 1 3.80 4.10 0.30 6.80 8.87 B 1 3.70 4.20 0.50 7.10 9.26 B 0 1 3.80 4.30 0.50 7.00 9.00 A 1 0 3.70 4.10 0.40 6.80 8.75 B 3.80 3.75 -0.05 6.50 7.95 B 0 1 3.80 3.75 -0.05 6.25 7.65 C 0 0 3.75 3.65 -0.10 6.00 7.27 A 1 0 3.70 3.90 0.20 6.50 8.00 3.55 3.65 0.10 7.00 8.50 3.60 4.10 0.50 6.80 8.75 3.65 4.25 0.60 6.80 9.21 AAAB 1 1 1 0 0 0 1 0 3.70 3.65 -0.05 6.50 8.27 C 0 3.75 3.75 0.00 5.75 7.67 B 1 0 3.80 3.85 0.05 5.80 7.93 0 1 3.70 4.25 0.55 6.80 9.26 0 1 Page 4 of 4 Statistics: Statistics: Multiple Linear Regression Please Solve problem. Page 1 of 4 Enterprise Industries produces Fresh, a brand of liquid laundry detergent. In order to manage its inventory more effectively and make revenue projections, the company would like to better predict demand for Fresh. To develop a prediction model, the company has gathered data concerning demand for Fresh over the last 30 sales periods (each sales period is defined to be a four-week period). The demand data are presented in table below concerning y (demand for Fresh liquid laundry detergent), x (the price of Fresh), x2 (the average industry price of competitors' similar detergents), and x3 (Enterprise Industries' advertising expenditure for Fresh). To ultimately increase the demand for Fresh, Enterprise Industries' marketing department is comparing the effectiveness of three different advertising campaigns. These campaigns are denoted as campaigns A, B, and C. Campaign A consists entirely of television commercials, campaign B consists of a balanced mixture of television and radio commercials, and campaign consists of a balanced mixture of television, radio, newspaper, and magazine ads. To conduct the study, Enterprise Industries has randomly selected one advertising campaign to be used in each of the 30 sales periods in table below. Although logic would indicate that each of campaigns A, B, and C should be used in 10 of the 30 sales periods, Enterprise Industries has made previous commitments to the advertising media involved in the study. As a result, campaigns A, B, and Cwere randomly assigned to, respectively, 9, 11, and 10 sales periods. Furthermore, advertising was done in only the first three weeks of each sales period, so that the carryover effect of the campaign used in a sales period to the next sales period would be minimized. Table lists the campaigns used in the sales periods. To compare the effectiveness of advertising campaigns A, B, and C, we define two dummy variables. Specifically, we define the dummy variable og to equal 1 if campaign Bis used in a sales period and 0 otherwise. Furthermore, we define the dummy variable De to equal 1 if campaign C is used in a sales period and 0 otherwise. Table presents the JMP output of a regression analysis of the Fresh demand data by using the model Historical Data Concerning Demand for Fresh Detergent Sales Period Price for Average Industry Advertising Expenditure Fresh, x1 1 3.85 Price, x2 for Fresh, x3 for Fresh, y Demand 3.80 5.50 7.38 2 3.75 4.00 6.75 8.51 3 3.70 4.30 7.25 9.52 4 3.70 3.70 5.50 7.50 3.60 3.85 7.00 9.33 6 3.60 3.80 6.50 8.28 7 3.60 3.75 6.75 8.75 8 3.80 3.85 5.25 7.87 9 3.80 3.65 5.25 7.10 10 3.85 4.00 6.00 8.00 11 3.90 4.10 6.50 7.89 12 3.90 4.00 6.25 8.15 13 3.70 4.10 7.00 9.10 14 3.75 4.20 6.90 8.86 15 3.75 4.10 6.80 8.90 16 3.80 4.10 6.80 8.87 17 3.70 4.20 7.10 9.26 18 3.80 4.30 7.00 9.00 19 3.70 4.10 6.80 8.75 20 3.80 3.75 6.50 7.95 21 3.80 3.75 6.25 7.65 22 3.75 3.65 6.00 7.27 23 3.70 3.90 6.50 8.00 24 3.55 3.65 7.00 8.50 25 3.60 4.10 6.80 8.75 26 3.65 4.25 6.80 9.21 27 3.70 3.65 6.50 8.27 28 3.75 3.75 5.75 7.67 29 3.80 3.85 5.80 7.93 30 3.70 4.25 6.80 9.26 Page 3 of 4 (a) In this model the parameter 84 represents the effect on mean demand of advertising campaign B compared to advertising campaign A, and the parameter es represents the effect on mean demand of advertising campaign C compared to advertising campaign A. Use the regression output to find and report a point estimate of each of the above effects and to test the significance of each of the above effects. Also, find and report a 95 percent confidence interval for each of the above effects. Interpret your results. (Round your answers to 4 decimal places.) The point estimate of the effect on the mean of campaign B compared to campaign A is b4 = The 95% confidence interval=[ The point estimate of the effect on the mean of campaign C compared to campaign A is b5 - The 95% confidence interval = [ Campaign is probably most effective even though intervals overlap. (b) The prediction results at the bottom of the output correspond to a future period when Fresh's price will be z = 3.70, the average price of similar detergents will be 2 = 3.90, Fresh's advertising expenditure will be x3 = 6.50, and advertising campaign C will be used. Show how = 8.61621 is calculated. Then find, report, and interpret a 95 percent confidence interval for mean demand and a 95 percent prediction interval for an individual demand when z = 3.70, x2 = 3.90, x3 = 6.50, and campaign C is used. (Round your answers to 5 decimal places.) y-hat Confidence interval Prediction interval (c) Consider the alternative model y= 6 +61 +62 2 + 83 23 84DA +85C + Here D equals 1 if advertising campaign A is used and equals 0 otherwise. Describe the effect represented by the regression parameter 65. B5-effect on mean of Campaign compared to Campaign B. Price IndPrice PriceDif AdvExp Demand AdCamp DA DB DC X1 X2 X4 X3 Y 3.85 3.80 -0.05 5.50 7.38 3.75 4.00 0.25 6.75 8.51 3.70 4.30 0.60 7.25 9.52 3.70 3.70 0.00 5.50 7.50 3.60 3.85 0.25 7.00 9.33 3.60 3.80 0.20 6.50 8.28 3.60 3.75 0.15 6.75 8.75 3.80 3.85 0.05 5.25 7.87 3.80 3.65 -0.15 5.25 7.10 BBBACACOB 11 1000 0 0 1 0 0 0 0 1 1 0 1 0 3.85 4.00 0.15 6.00 8.00 C 0 0 1 3.90 4.10 0.20 6.50 7.89 A 1 0 0 3.90 4.00 0.10 6.25 8.15 3.70 4.10 0.40 7.00 9.10 00 0 1 0 0 1 3.75 4.20 0.45 6.90 8.86 A 3.75 4.10 0.35 6.80 8.90 B 1 3.80 4.10 0.30 6.80 8.87 B 1 3.70 4.20 0.50 7.10 9.26 B 0 1 3.80 4.30 0.50 7.00 9.00 A 1 0 3.70 4.10 0.40 6.80 8.75 B 3.80 3.75 -0.05 6.50 7.95 B 0 1 3.80 3.75 -0.05 6.25 7.65 C 0 0 3.75 3.65 -0.10 6.00 7.27 A 1 0 3.70 3.90 0.20 6.50 8.00 3.55 3.65 0.10 7.00 8.50 3.60 4.10 0.50 6.80 8.75 3.65 4.25 0.60 6.80 9.21 AAAB 1 1 1 0 0 0 1 0 3.70 3.65 -0.05 6.50 8.27 C 0 3.75 3.75 0.00 5.75 7.67 B 1 0 3.80 3.85 0.05 5.80 7.93 0 1 3.70 4.25 0.55 6.80 9.26 0 1 Page 4 of 4
Expert Answer:

Posted Date:
Students also viewed these mathematics questions
-
Listed below are the genders of the younger winner in the categories of Best Actor and Best Actress for recent and consecutive years. Do the genders of the younger winners appear to occur randomly? F...
-
A company reports the following: Cost of goods sold .......$630,000 Average inventory ....... 90,000 Determine (a) The inventory turnover (b) The number of days sales in inventory. Round to one...
-
Members ABC and BD of the counter chair are rigidly connected at B and the smooth collar at D is allowed to move freely along the vertical post. Draw the shear and moment diagrams for member ABC. -P...
-
Wurstenheimer Company is a small manufacturer of specialty meat products which utilizes a standard cost system. The following standards have been developed for one pound of smoked German sausage. (a)...
-
Jenkins Health Care Center, Inc., has three clinics servicing the Seattle metropolitan area. The companys legal services department supports the clinics. Moreover, its computer services department...
-
Calculate amount of tax due: Note: Round your answers to the nearest cent. Tax Rate $12.75 per $100 Assessed Value Tax Due $ 14,500 $62.50 per $1,000 . $ 67,800 16 mills $ 599 225,000 @ 2 C W < Prev...
-
Problem 1 Water at 10C flows at the rate of 900 L/min from the reservoir and through the pipe shown in Fig. 8.16. Compute the pressure at point B, considering the energy loss due to friction, but...
-
Electro Company makes battery powered ebikes. They cost $1,600 to make which consists of $400 labor and $1,200 parts. They are sold with a one-year unlimited warranty on parts only (customer pays...
-
Pie Co. uses the installment sales method to recognize revenue. Customers pay theinstallment notes in 24 equal monthly amounts, which include 12% interest. What is aninstallment note's receivable...
-
Evaluate a great leader The leader that we picked is Mustafa Kemal Ataturk(Founder OF TURKEY) Take some time now to evaluate the great leader you identified against the keys of leadership we just...
-
Grant Corporation manufactures a drink bottle, model CL24. During 2020, Grant produced 240,000 bottles at a total cost of $1,080,000. Wren Corporation has offered to supply as many bottles as Grant...
-
COMP1005/5005 - Practical Test 3 Run a web browser in the Virtual Machine and download the zip and data file from Blackboard/Assessments Unzip them into the PracTest3 directory. Complete the four...
-
A company expects sales to increase during the coming year, and needs to estimate whether outside capital will need to be raised. Which of the following conditions would increase the need for outside...
-
The following processes constitute the air-standard Diesel cycle: 12: isentropic compression,23: constant-volume energy addition (T and P increase),34: constant-pressure energy addition (v...

Study smarter with the SolutionInn App