

Stock.com/O Case 1 You Can Look It Up! Not only is the amount of data collected...
Fantastic news! We've Found the answer you've been seeking!
Question:
Transcribed Image Text:
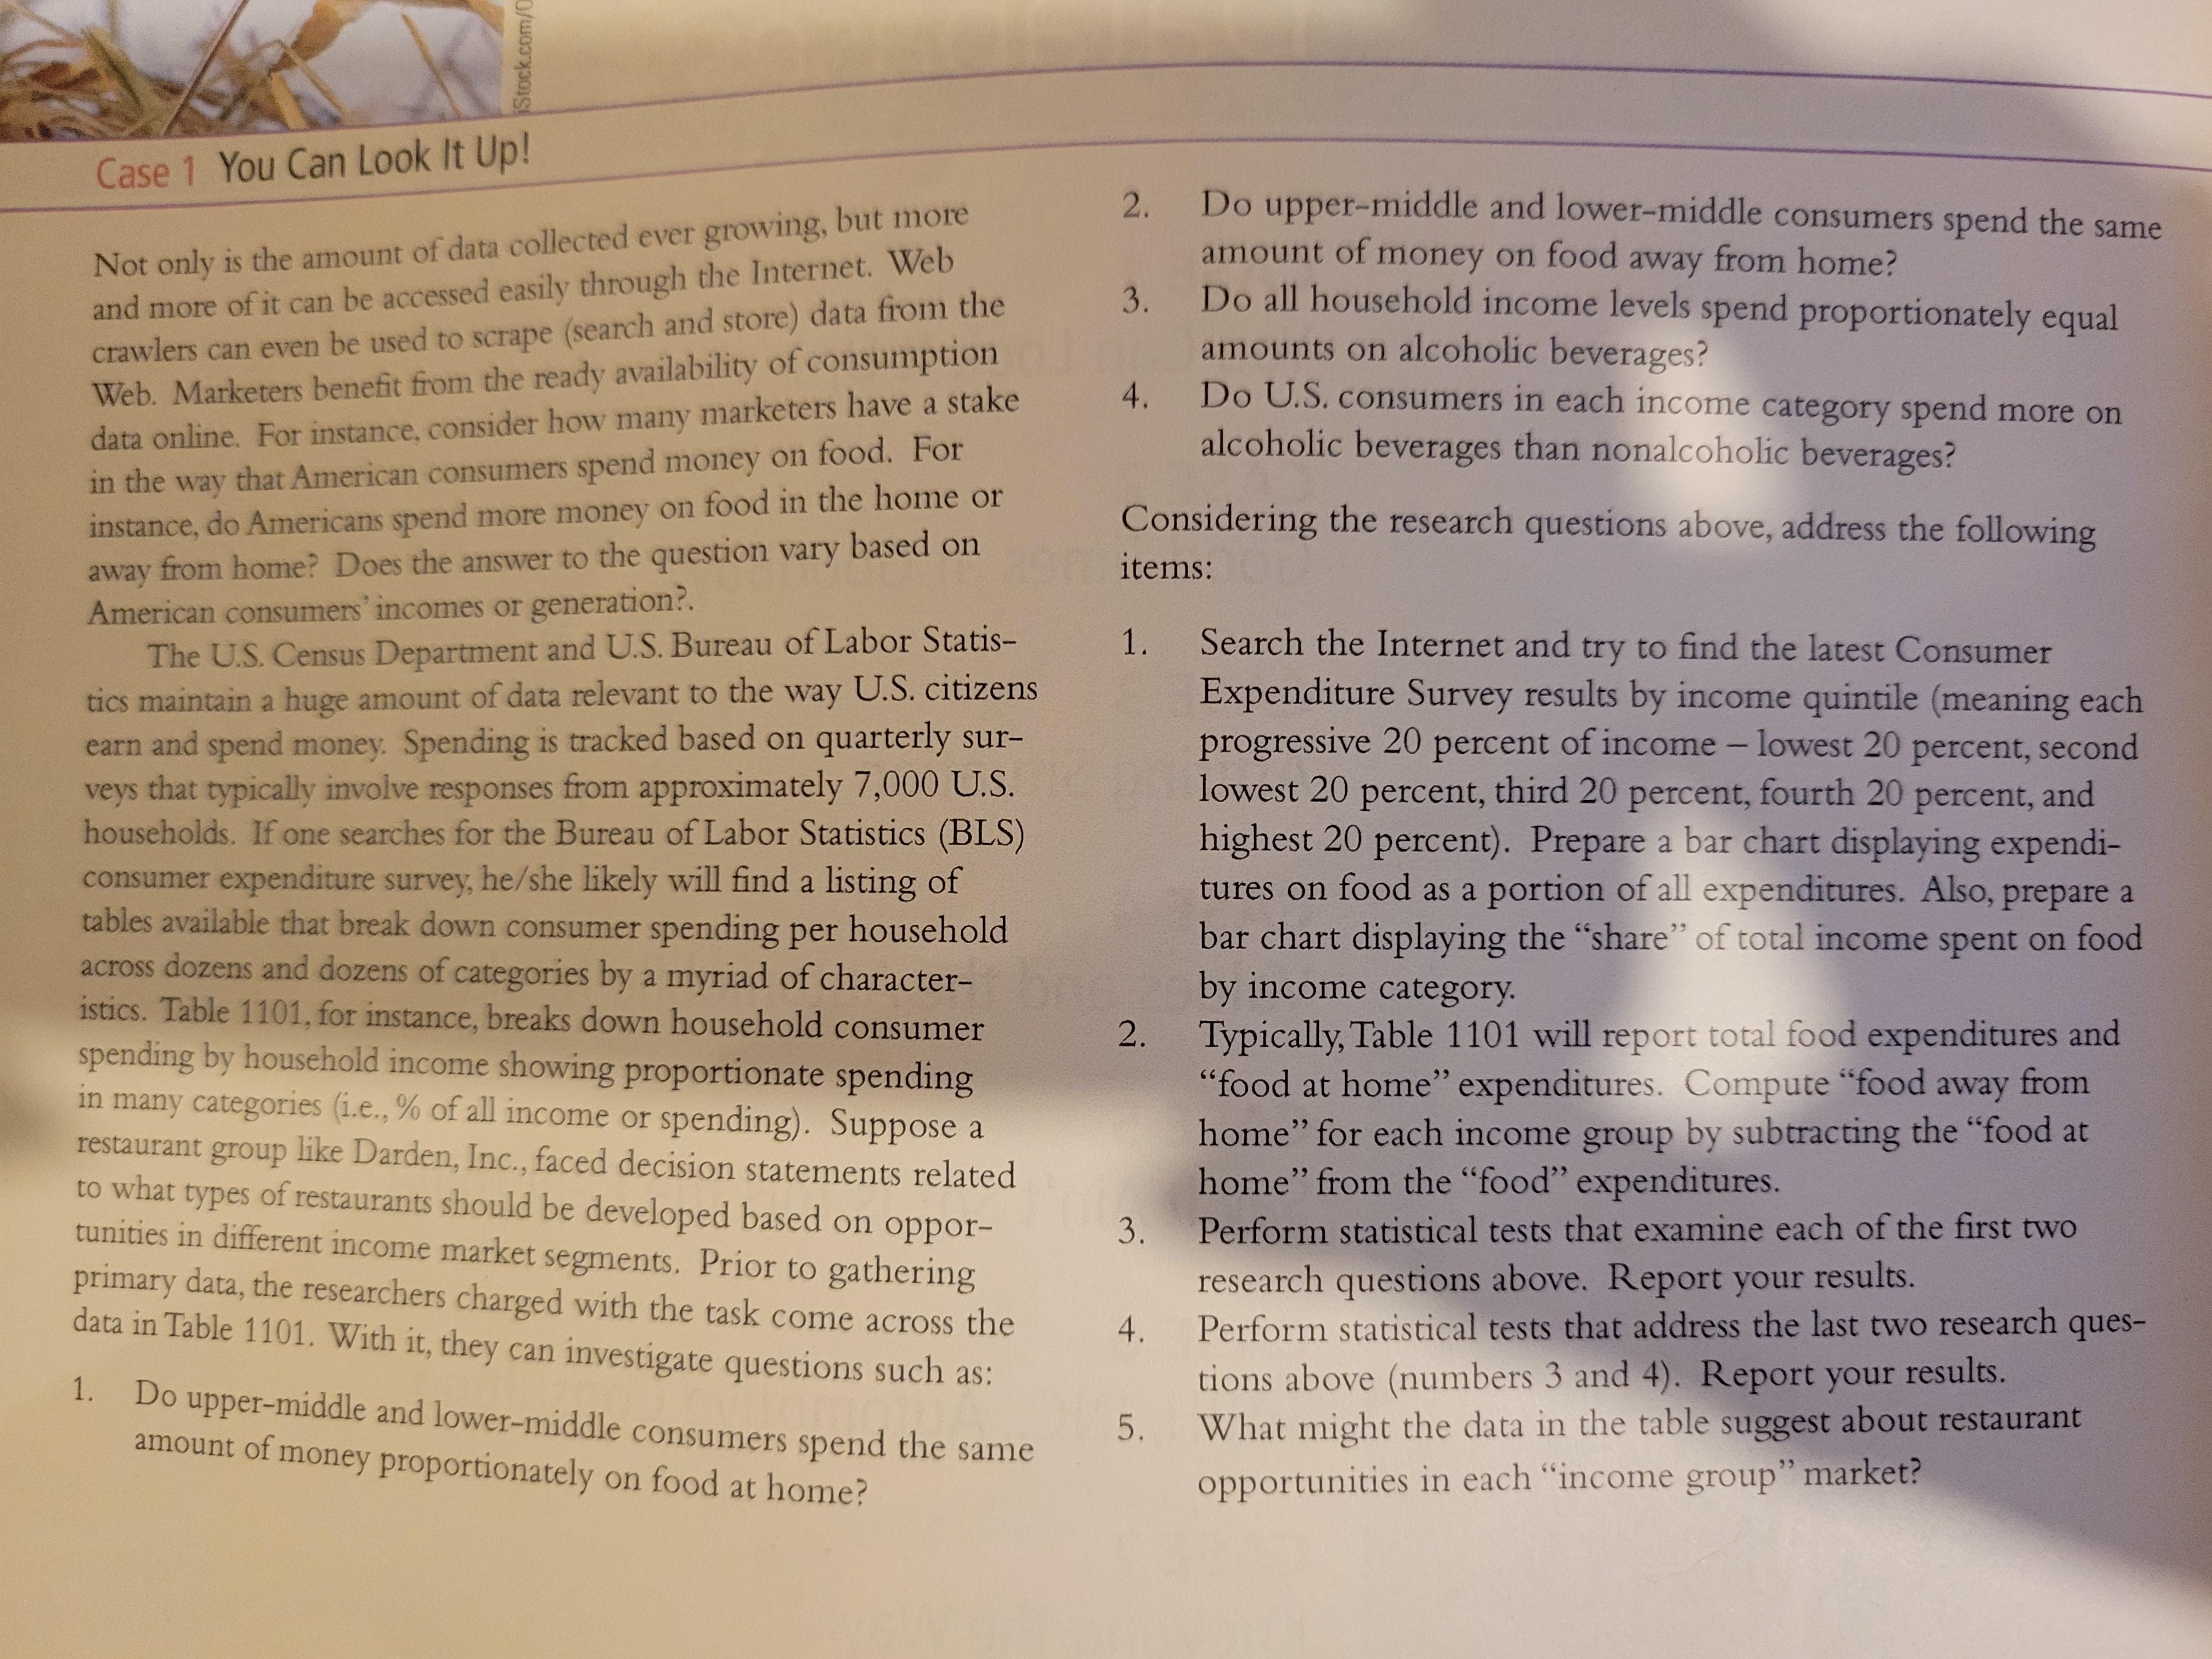
Stock.com/O Case 1 You Can Look It Up! Not only is the amount of data collected ever growing, but more and more of it can be accessed easily through the Internet. Web crawlers can even be used to scrape (search and store) data from the Web. Marketers benefit from the ready availability of consumption data online. For instance, consider how many marketers have a stake in the way that American consumers spend money on food. For instance, do Americans spend more money on food in the home or away from home? Does the answer to the question vary based on American consumers' incomes or generation?. The U.S. Census Department and U.S. Bureau of Labor Statis- tics maintain a huge amount of data relevant to the way U.S. citizens earn and spend money. Spending is tracked based on quarterly sur- veys that typically involve responses from approximately 7,000 U.S. households. If one searches for the Bureau of Labor Statistics (BLS) consumer expenditure survey, he/she likely will find a listing of tables available that break down consumer spending per household across dozens and dozens of categories by a myriad of character- istics. Table 1101, for instance, breaks down household consumer spending by household income showing proportionate spending in many categories (i.e., % of all income or spending). Suppose a restaurant group like Darden, Inc., faced decision statements related to what types of restaurants should be developed based on oppor- tunities in different income market segments. Prior to gathering primary data, the researchers charged with the task come across the data in Table 1101. With it, they can investigate questions such as: 1. Do upper-middle and lower-middle consumers spend the same amount of money proportionately on food at home? 2. 3. 4. Do upper-middle and lower-middle consumers spend the same amount of money on food away from home? Do all household income levels spend proportionately equal amounts on alcoholic beverages? Do U.S. consumers in each income category spend more on alcoholic beverages than nonalcoholic beverages? Considering the research questions above, address the following items: 1. Search the Internet and try to find the latest Consumer Expenditure Survey results by income quintile (meaning each progressive 20 percent of income - lowest 20 percent, second lowest 20 percent, third 20 percent, fourth 20 percent, and highest 20 percent). Prepare a bar chart displaying expendi- tures on food as a portion of all expenditures. Also, prepare a bar chart displaying the "share" of total income spent on food by income category. 2. Typically, Table 1101 will report total food expenditures and "food at home" expenditures. Compute "food away from home" for each income group by subtracting the "food at home" from the "food" expenditures. 3. 4. Perform statistical tests that examine each of the first two research questions above. Report your results. Perform statistical tests that address the last two research ques- tions above (numbers 3 and 4). Report your results. 5. What might the data in the table suggest about restaurant opportunities in each "income group" market? Stock.com/O Case 1 You Can Look It Up! Not only is the amount of data collected ever growing, but more and more of it can be accessed easily through the Internet. Web crawlers can even be used to scrape (search and store) data from the Web. Marketers benefit from the ready availability of consumption data online. For instance, consider how many marketers have a stake in the way that American consumers spend money on food. For instance, do Americans spend more money on food in the home or away from home? Does the answer to the question vary based on American consumers' incomes or generation?. The U.S. Census Department and U.S. Bureau of Labor Statis- tics maintain a huge amount of data relevant to the way U.S. citizens earn and spend money. Spending is tracked based on quarterly sur- veys that typically involve responses from approximately 7,000 U.S. households. If one searches for the Bureau of Labor Statistics (BLS) consumer expenditure survey, he/she likely will find a listing of tables available that break down consumer spending per household across dozens and dozens of categories by a myriad of character- istics. Table 1101, for instance, breaks down household consumer spending by household income showing proportionate spending in many categories (i.e., % of all income or spending). Suppose a restaurant group like Darden, Inc., faced decision statements related to what types of restaurants should be developed based on oppor- tunities in different income market segments. Prior to gathering primary data, the researchers charged with the task come across the data in Table 1101. With it, they can investigate questions such as: 1. Do upper-middle and lower-middle consumers spend the same amount of money proportionately on food at home? 2. 3. 4. Do upper-middle and lower-middle consumers spend the same amount of money on food away from home? Do all household income levels spend proportionately equal amounts on alcoholic beverages? Do U.S. consumers in each income category spend more on alcoholic beverages than nonalcoholic beverages? Considering the research questions above, address the following items: 1. Search the Internet and try to find the latest Consumer Expenditure Survey results by income quintile (meaning each progressive 20 percent of income - lowest 20 percent, second lowest 20 percent, third 20 percent, fourth 20 percent, and highest 20 percent). Prepare a bar chart displaying expendi- tures on food as a portion of all expenditures. Also, prepare a bar chart displaying the "share" of total income spent on food by income category. 2. Typically, Table 1101 will report total food expenditures and "food at home" expenditures. Compute "food away from home" for each income group by subtracting the "food at home" from the "food" expenditures. 3. 4. Perform statistical tests that examine each of the first two research questions above. Report your results. Perform statistical tests that address the last two research ques- tions above (numbers 3 and 4). Report your results. 5. What might the data in the table suggest about restaurant opportunities in each "income group" market?
Expert Answer:

Related Book For 

Principles of Auditing and Other Assurance Services
ISBN: 978-0078025617
19th edition
Authors: Ray Whittington, Kurt Pany
Posted Date:
Students also viewed these marketing questions
-
1 What are the main components of personal financial planning? Solve What is the purpose of a financial plan? Solve Identify some common actions taken to achieve financial goals. How does a job...
-
CANMNMM January of this year. (a) Each item will be held in a record. Describe all the data structures that must refer to these records to implement the required functionality. Describe all the...
-
A stiff, straight, horizontal wire of length 25 cm and mass 20 g is supported by electrical contacts at its ends, but is otherwise free to move vertically upward. The wire is in a uniform, horizontal...
-
Calculate the coefficient of performance of the R-12 heat pump cycle described in Problem 6.106.
-
Determine the equivalent spring constant of the arrangement shown in Figure. All the springs have the same spring constant k.
-
Discuss the differences between the characteristics of low- and high-value sales.
-
The Espy Company recently had an outside consulting rm perform an audit of its information systems department. One of the consultants identified some business risks and their probability of...
-
Complete the sumAndCast() method that casts the parameters from doubles to integers and returns the resulting sum. Note that the main() method prints out the returned value of the sumAndCast()...
-
My first output under population is displayed as a int (2) however the example below is a float (2.0) My other problem is line 9 doesn't print the 5th decimal number. My output displays 16.314...
-
Consider the welding situation of the previous problem. This time let's consider the case where we have convective heat transfer from the rod's surface. For a rod of radius, \(r_{o}\), and a heat...
-
Why dont we measure national output by simply counting the total number of goods and services produced each year?
-
As a biochemical engineer you are evaluating a drug delivery system for an artificial protein to combat Alzheimer's. The protein is very large (200,000 molecular weight) and bulky and is sensitive to...
-
If the ellipse: \[a\left(x^{2}-y^{2} ight)+2 b x y-\frac{1}{2} \omega_{o}\left(x^{2}+y^{2} ight)+c=0\] is full of liquid and is rotated about the origin with an angular velocity, \(\omega_{o}\), the...
-
In Smoluchowski's Theory of Coagulation we focus on an individual sphere and assume that other like particles diffuse toward it. Once they reach the sphere, they collide and form a new spherical...
-
As a manager, one has many duties beyond operations of the business. Developing a cohesive team is one of those added duties. With this in mind, how can group cohesiveness be increased? Give specific...
-
In Exercises evaluate the limit, using LHpitals Rule if necessary. lim 07x cos x X
-
Cavett Problem. A process having multiple recycle loops formulated by R.H. Cavett [Proc. Am. Petrol. Inst., 43, 57 (1963)] has been used extensively to test tearing, sequencing, and convergence...
-
Consider the ammonia process in which \(\mathrm{N}_{2}\) and \(\mathrm{H}_{2}\) (with impurities \(\mathrm{Ar}\) and \(\mathrm{CH}_{4}\) ) are converted to \(\mathrm{NH}_{3}\) at high pressure...
-
Use a process simulator to model a two-stage compression system with an intercooler. The feed stream consists of \(95 \mathrm{~mol} \%\) hydrogen and \(5 \mathrm{~mol} \%\) methane at \(100^{\circ}...

Study smarter with the SolutionInn App