

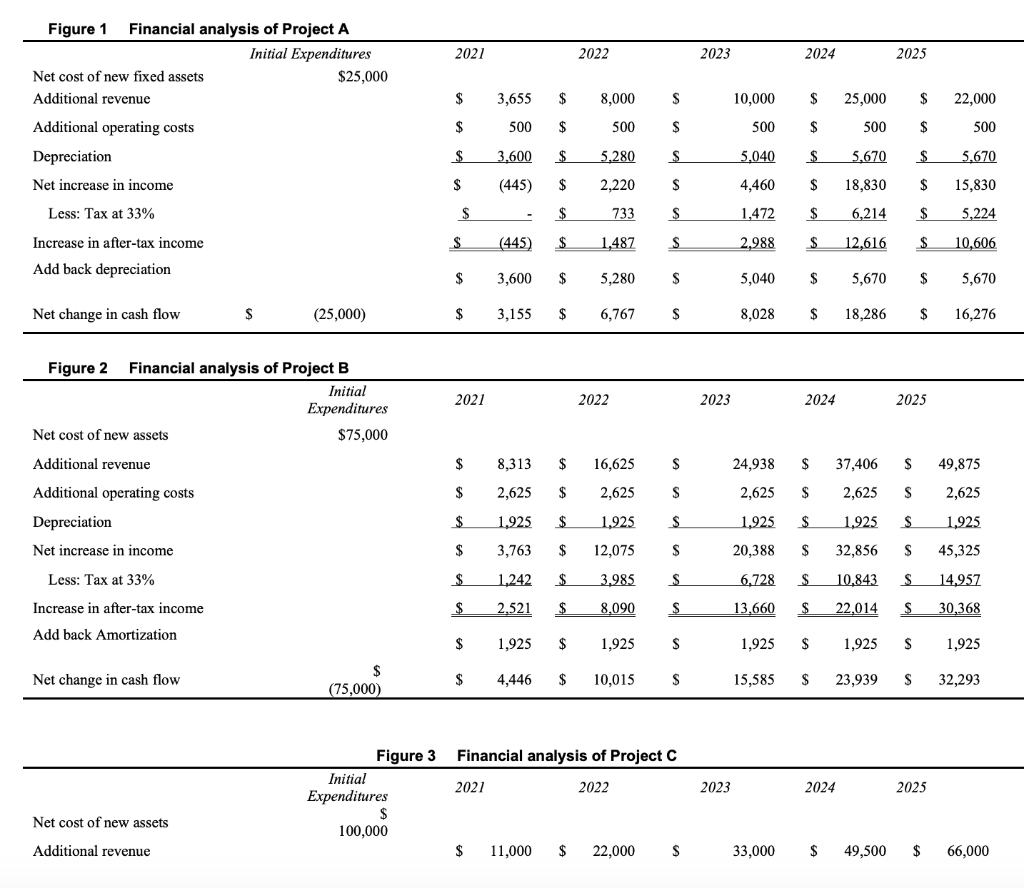
Figure 1 Financial analysis of Project A Initial Expenditures Net cost of new fixed assets Additional...
Fantastic news! We've Found the answer you've been seeking!
Question:
Expert Answer:
Here are more detailed analyses of the projects and company financials Project A Analysis 2021 Initial expenditure of 25000 Additional revenue of 3655 Additional operating costs of 500 Depreciation of ... View the full answer

Related Book For 

Posted Date:
