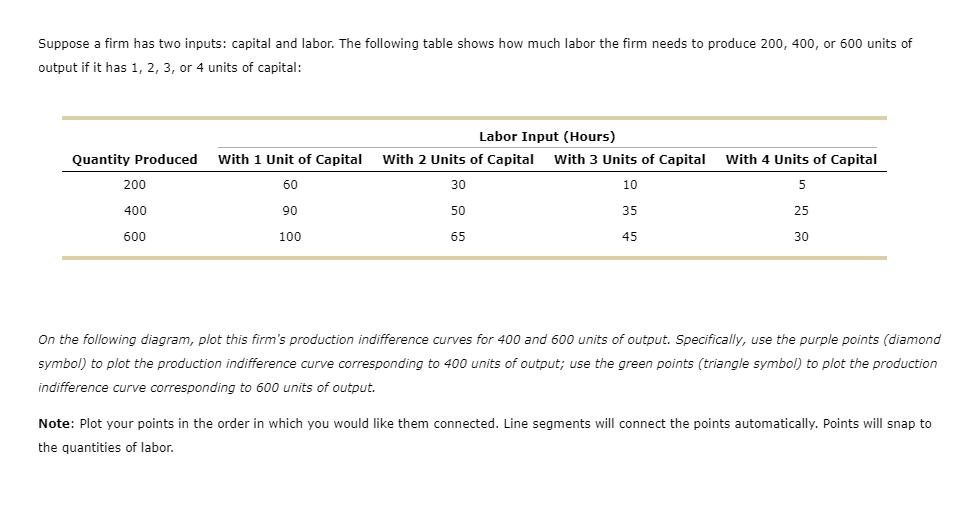
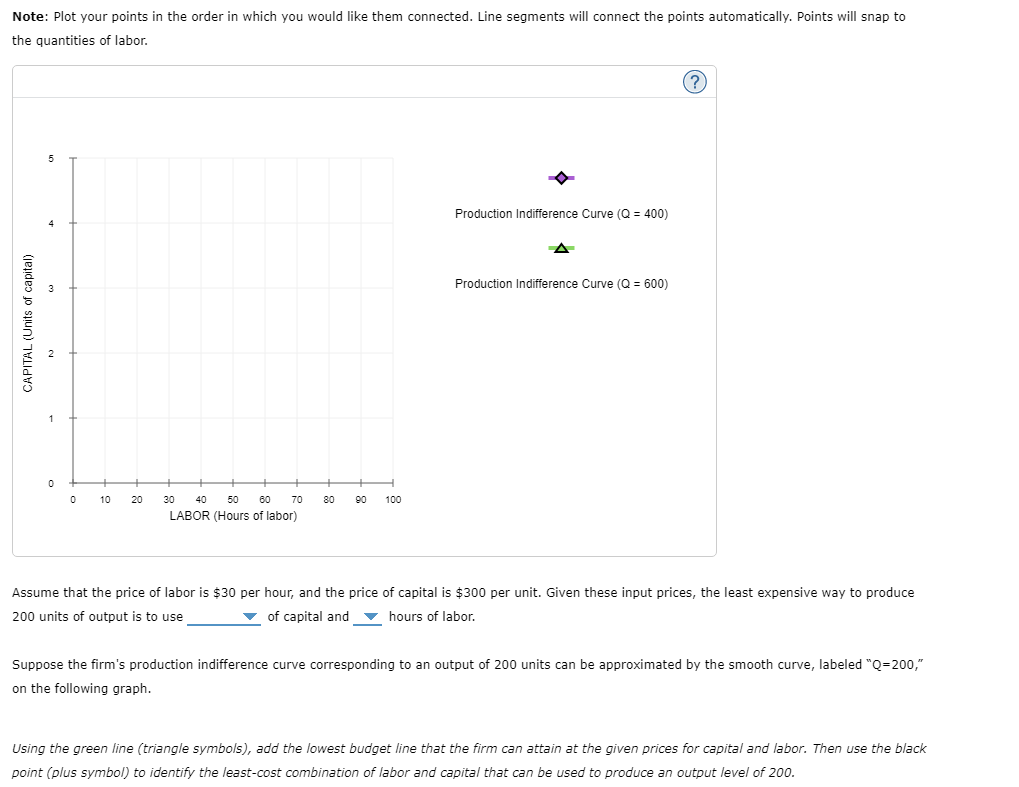
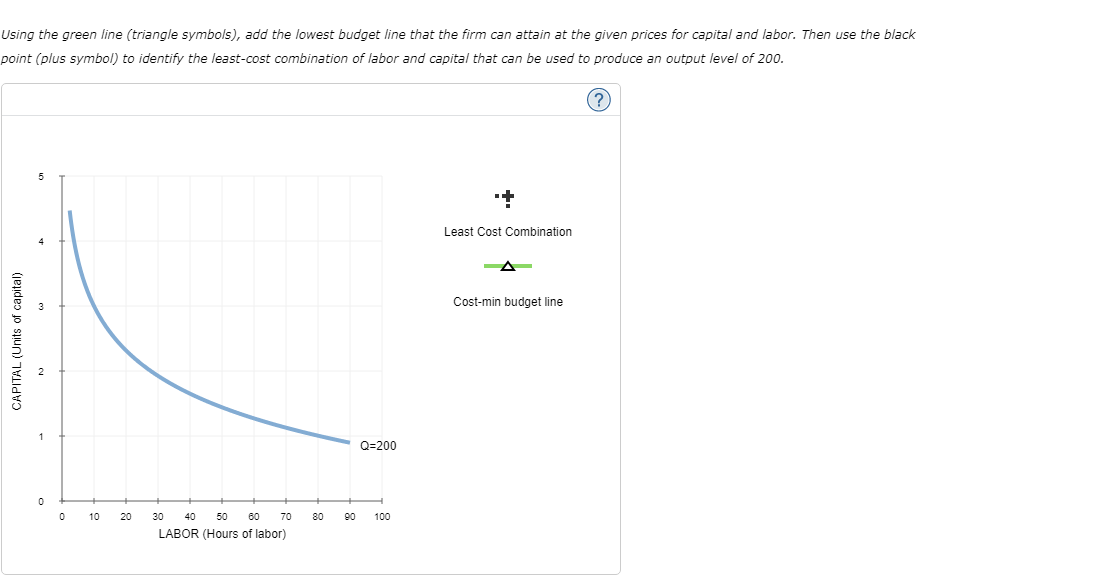
Suppose a firm has two inputs: capital and labor. The following table shows how much labor...
Fantastic news! We've Found the answer you've been seeking!
Question:
Transcribed Image Text:
Suppose a firm has two inputs: capital and labor. The following table shows how much labor the firm needs to produce 200, 400, or 600 units of output if it has 1, 2, 3, or 4 units of capital: Labor Input (Hours) Quantity Produced With 1 Unit of Capital With 2 Units of Capital With 3 Units of Capital With 4 Units of Capital 200 60 30 10 5 400 90 50 35 25 600 100 65 45 30 On the following diagram, plot this firm's production indifference curves for 400 and 600 units of output. Specifically, use the purple points (diamond symbol) to plot the production indifference curve corresponding to 400 units of output; use the green points (triangle symbol) to plot the production indifference curve corresponding to 600 units of output. Note: Plot your points in the order in which you would like them connected. Line segments will connect the points automatically. Points will snap to the quantities of labor. CAPITAL (Units of capital) Note: Plot your points in the order in which you would like them connected. Line segments will connect the points automatically. Points will snap to the quantities of labor. 1 5 0 0 10 20 30 40 50 60 70 80 90 100 LABOR (Hours of labor) Production Indifference Curve (Q= 400) Production Indifference Curve (Q= 600) (?) Assume that the price of labor is $30 per hour, and the price of capital is $300 per unit. Given these input prices, the least expensive way to produce 200 units of output is to use of capital and hours of labor. Suppose the firm's production indifference curve corresponding to an output of 200 units can be approximated by the smooth curve, labeled "Q=200," on the following graph. Using the green line (triangle symbols), add the lowest budget line that the firm can attain at the given prices for capital and labor. Then use the black point (plus symbol) to identify the least-cost combination of labor and capital that can be used to produce an output level of 200. CAPITAL (Units of capital) 1 Using the green line (triangle symbols), add the lowest budget line that the firm can attain at the given prices for capital and labor. Then use the black point (plus symbol) to identify the least-cost combination of labor and capital that can be used to produce an output level of 200. ? Q=200 0 0 10 20 30 40 50 60 70 80 90 100 LABOR (Hours of labor) + Least Cost Combination Cost-min budget line Suppose a firm has two inputs: capital and labor. The following table shows how much labor the firm needs to produce 200, 400, or 600 units of output if it has 1, 2, 3, or 4 units of capital: Labor Input (Hours) Quantity Produced With 1 Unit of Capital With 2 Units of Capital With 3 Units of Capital With 4 Units of Capital 200 60 30 10 5 400 90 50 35 25 600 100 65 45 30 On the following diagram, plot this firm's production indifference curves for 400 and 600 units of output. Specifically, use the purple points (diamond symbol) to plot the production indifference curve corresponding to 400 units of output; use the green points (triangle symbol) to plot the production indifference curve corresponding to 600 units of output. Note: Plot your points in the order in which you would like them connected. Line segments will connect the points automatically. Points will snap to the quantities of labor. CAPITAL (Units of capital) Note: Plot your points in the order in which you would like them connected. Line segments will connect the points automatically. Points will snap to the quantities of labor. 1 5 0 0 10 20 30 40 50 60 70 80 90 100 LABOR (Hours of labor) Production Indifference Curve (Q= 400) Production Indifference Curve (Q= 600) (?) Assume that the price of labor is $30 per hour, and the price of capital is $300 per unit. Given these input prices, the least expensive way to produce 200 units of output is to use of capital and hours of labor. Suppose the firm's production indifference curve corresponding to an output of 200 units can be approximated by the smooth curve, labeled "Q=200," on the following graph. Using the green line (triangle symbols), add the lowest budget line that the firm can attain at the given prices for capital and labor. Then use the black point (plus symbol) to identify the least-cost combination of labor and capital that can be used to produce an output level of 200. CAPITAL (Units of capital) 1 Using the green line (triangle symbols), add the lowest budget line that the firm can attain at the given prices for capital and labor. Then use the black point (plus symbol) to identify the least-cost combination of labor and capital that can be used to produce an output level of 200. ? Q=200 0 0 10 20 30 40 50 60 70 80 90 100 LABOR (Hours of labor) + Least Cost Combination Cost-min budget line
Expert Answer:
Related Book For
Posted Date:
Students also viewed these economics questions
-
A taxpayer tells you they had health insurance coverage all year, but did not bring proof of coverage. This information, along with all the other information gathered during your interview, does not...
-
In Section 36.6 we saw that muons can reach the ground because of time dilation. But how do things appear in the muons reference frame, where the muons half-life is only 1.5 s? How can a muon travel...
-
Implement the linear optimization model that you developed for Burger Office Equipment Burger Office Equipment produces two types of desks, standard and deluxe. Deluxe desks have oak tops and more...
-
If the area to the right of x in a normal distribution is 0.543, what is the area to the left of x? Use the following information to answer the next four exercises: X ~ N(54, 8)
-
The revenue recognition principle says a. record revenue only after you have earned it. b. record revenue only when you receive cash. c. match revenues and expenses in order to compute net income. d....
-
Consider the enterprise systems application areas listed in Figure. Which application area developed first? Which one is most common today? What is a hot application area today? FIGURE Enterprise...
-
A charge of 91 =8.4 C is located at (x1,y1) = (-7.9 m, 4.8 m). A charge of 92 =7.6 C is located at (x2, y2)=(2 m, 5.5 m). A charge of 93 =-4.1 nC is located at the origin. In newtons, what is the y-...
-
BubblyCo is currently evaluating a new carbonated orange juice product called Bubblo Soda that is superior to competing orange products. The company has finished a market study that shows promising...
-
What mistake did the NBA make in its dealings with the owners of the Spirits of St. Louis?
-
What concerns should a sport organization contemplate when negotiating future payments from sponsorships or other long-term agreements?
-
An object that is \(40 \mathrm{~mm}\) tall is placed \(60 \mathrm{~mm}\) in front of a converging thin lens. If the image is inverted and \(80 \mathrm{~mm}\) tall, what are \((a)\) the distance from...
-
A bank offers customers the option of receiving interest compounded quarterly, semi-annually, or annually. If the rate of interest is the same, which is the best option for the customer?
-
What is a stock market index? What is an index designed to accomplish?
-
The Web 2.0 revolution has changed the way businesses communicate with consumers and within their own organizations. Podcasts, wikis, and blogs can be used to build reputations, communicate with...
-
Imagine a sound wave with a frequency of 1.10 kHz propagating with a speed of 330 m/s. Determine the phase difference in radians between any two points on the wave separated by 10.0 cm.
-
The auditor will not ordinarily initiate discussion with the audit committee concerning the a. Extent to which the work of internal auditors will influence the scope of the audit. b. Extent to which...
-
Why are auditors concerned with related parties during the planning process?
-
Which of the following should an auditor obtain from the predecessor auditor prior to accepting an audit engagement? a. Analysis of balance sheet accounts. b. Analysis of income statement accounts....
Study smarter with the SolutionInn App