

Suppose a hypothetical open economy uses the U.S. dollar as currency. The table below presents data describing
Question:
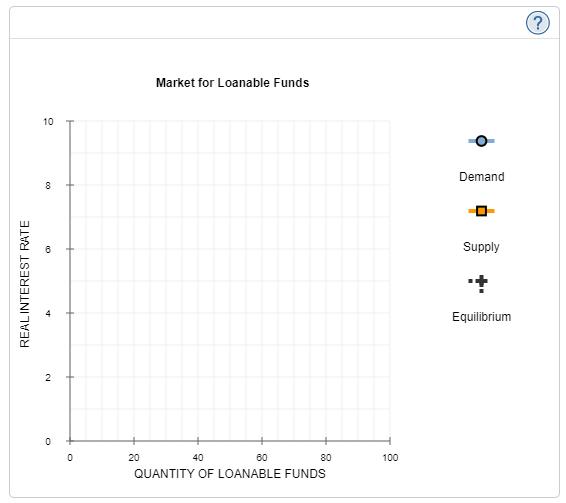
Suppose a hypothetical open economy uses the U.S. dollar as currency. The table below presents data describing the relationship between different real interest rates and this economy's levels of national saving, domestic investment, and net capital outflow. Assume that the economy is currently operating under a balanced government budget.
| Real Interest Rate | National Saving | Domestic Investment | Net Capital Outflow |
|---|---|---|---|
| (Percent) | (Billions of dollars) | (Billions of dollars) | (Billions of dollars) |
| 7 | 45 | 25 | -10 |
| 6 | 40 | 30 | -5 |
| 5 | 35 | 35 | 0 |
| 4 | 30 | 40 | 5 |
| 3 | 25 | 45 | 10 |
| 2 | 20 | 50 | 15 |
Given the information in the table above, use the blue points (circle symbol) to plot the demand for loanable funds. Next, use the orange points (square symbol) to plot the supply of loanable funds. Finally, use the black point (cross symbol) to indicate the equilibrium in this market.
On the following graph, plot the relationship between the real interest rate and net capital outflow by using the green points (triangle symbol) to plot the points from the initial data table. Then use the black point (X symbol) to indicate the level of net capital outflow at the equilibrium real interest rate you derived in the previous graph.
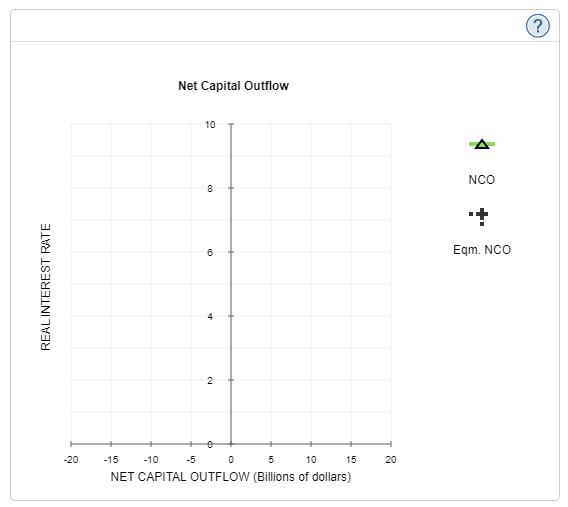
Because of the relationship between net capital outflow and net exports, the level of net capital outflow at the equilibrium real interest rate implies that the economy is experiencing ("a trade deficit" OR "a trade surplus" OR "balanced trade")
Now, suppose the government is experiencing a budget deficit. This means that ("national saving will increase" OR "national saving will decrease" OR "domestic investment will increase" OR "domestic investment will decrease"), which leads to ("increase in the supply of" OR "a decrease in the supply of" OR "an increase in the demand for" OR "a decrease in the demand for" loanable funds.
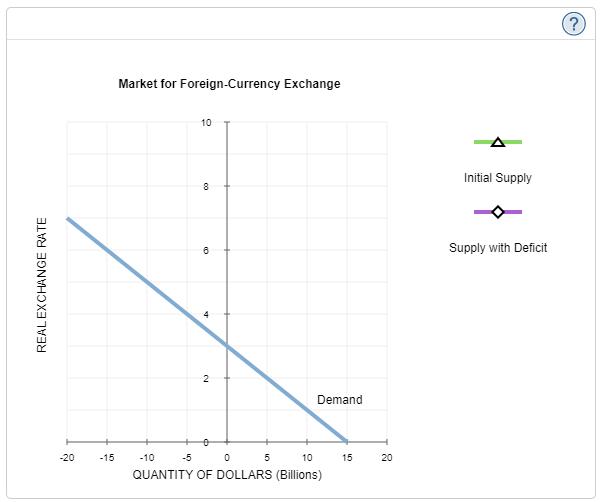
After the budget deficit occurs, suppose the new equilibrium real interest rate is 6%. The following graph shows the demand curve in the foreign-currency exchange market.
Use the green line (triangle symbol) to show the supply curve in this market before the budget deficit. Then use the purple line (diamond symbol) to show the supply curve after the budget deficit.
Summarize the effects of a budget deficit by filling in the following table.
| Real Interest Rate | Real Exchange Rate | Trade Balance | |
|---|---|---|---|
| Effects of a Budget Deficit | (increases OR decreases) | (increases OR decreases) | (surplus OR deficit) |
Expert Answer:
Lets go through the question step by step 1 Plot the demand for loanable funds blue points circle symbol In an economy demand for loanable funds primarily comes from domestic investment As the real in... View the full answer


Macroeconomics
ISBN: 9780132109994
1st Edition
Authors: Glenn Hubbard, Anthony Patrick O'Brien, Matthew P Rafferty
