

Suppose Google had acquired Motorola by issuing shares instead of paying cash. Would Total Stockholders' equity...
Fantastic news! We've Found the answer you've been seeking!
Question:
Transcribed Image Text:
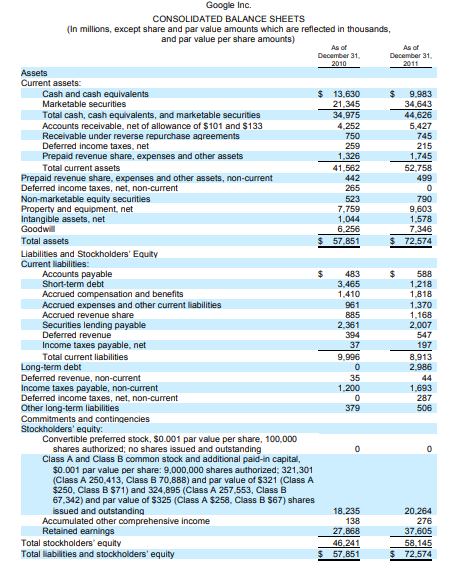
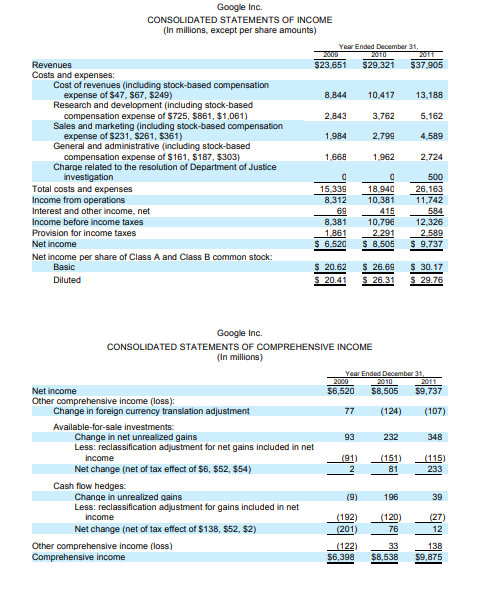
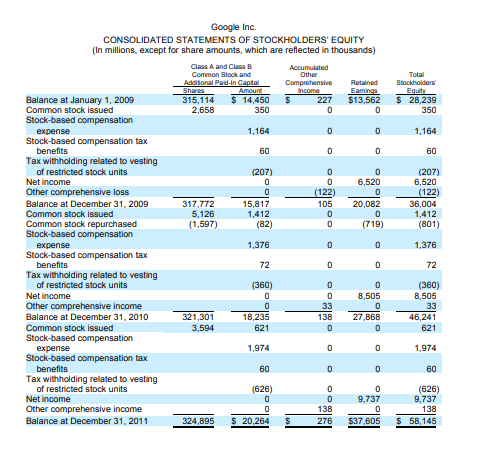
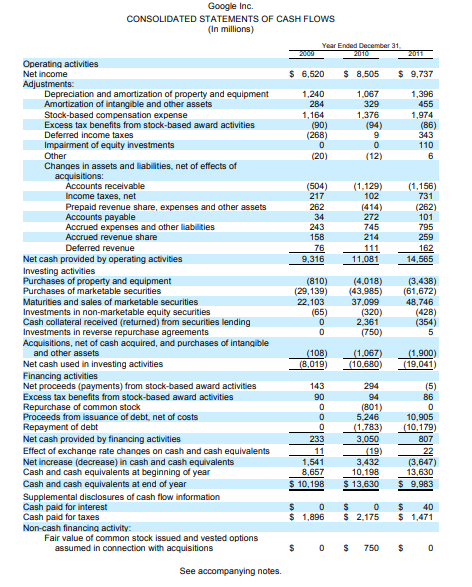
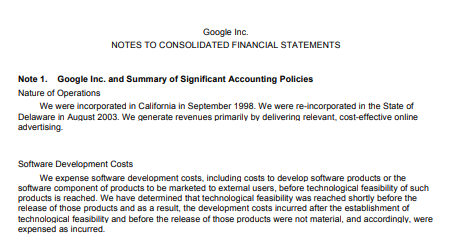
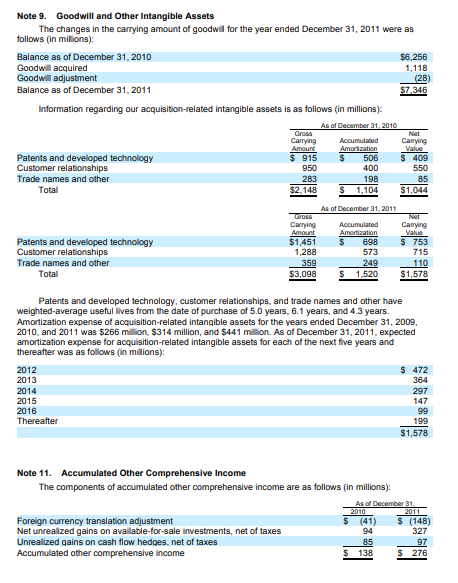
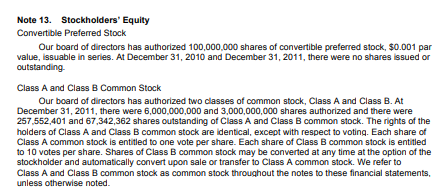
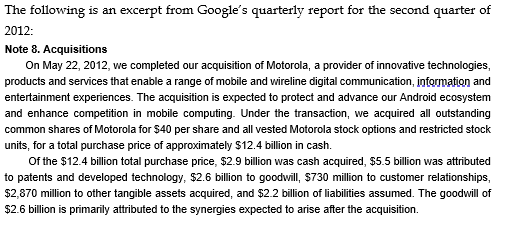
Suppose Google had acquired Motorola by issuing shares instead of paying cash. Would Total Stockholders' equity as of the date of the acquisition, May 22, 2012 have been higher than, lower than or the same as currently reported? If different, by how much? Higher If higher/lower, by how much Lower The Same Google Inc. CONSOLIDATED BALANCE SHEETS (In millions, except share and par value amounts which are reflected in thousands, and par value per share amounts) Assets Current assets: Cash and cash equivalents Marketable securities Total cash, cash equivalents, and marketable securities Accounts receivable, net of allowance of $101 and $133 Receivable under reverse repurchase agreements Deferred income taxes, net Prepaid revenue share, expenses and other assets Total current assets Prepaid revenue share, expenses and other assets, non-current Deferred income taxes, net, non-current Non-marketable equity securities Property and equipment, net Intangible assets, net Goodwill Total assets Liabilities and Stockholders' Equity Current liabilities: Accounts payable Short-term debt Accrued compensation and benefits Accrued expenses and other current liabilities Accrued revenue share Securities lending payable Deferred revenue Income taxes payable, net Total current liabilities Long-term debt Deferred revenue, non-current Income taxes payable, non-current Deferred income taxes, net, non-current Other long-term liabilities Commitments and contingencies Stockholders' equity: Convertible preferred stock, $0.001 par value per share, 100,000 shares authorized; no shares issued and outstanding Class A and Class B common stock and additional paid-in capital, $0.001 par value per share: 9,000,000 shares authorized: 321,301 (Class A 250,413, Class B 70,888) and par value of $321 (Class A $250, Class B $71) and 324,895 (Class A 257,553, Class B 67,342) and par value of $325 (Class A $258, Class B $67) shares issued and outstanding Accumulated other comprehensive income Retained earnings Total stockholders' equity Total liabilities and stockholders' equity As of December 31, 2010 $ 13.630 21,345 34,975 4,252 750 259 $ 1,326 41,562 442 265 523 7,759 1,044 6,256 $ 57,851 483 3,465 1,410 961 885 2,361 394 37 9,996 0 35 1,200 0 379 18,235 138 27,868 46,241 $ 57,851 As of December 31, 2011 $ 9.983 34,643 44,626 5,427 745 215 1,745 $ 52,758 499 0 790 9,603 1,578 7,346 $ 72,574 588 1,218 1,818 1.370 1,168 2,007 547 197 8,913 2,986 44 1,693 287 506 0 20,264 276 37,605 58,145 $ 72,574 Revenues Costs and expenses: Cost of revenues (including stock-based compensation expense of $47, $67, $249) Research and development (including stock-based compensation expense of $725, $861, $1,061) Sales and marketing (including stock-based compensation expense of $231, $261, $361) Google Inc. CONSOLIDATED STATEMENTS OF INCOME (In millions, except per share amounts) General and administrative (including stock-based compensation expense of $161, $187, $303) Charge related to the resolution of Department of Justice investigation Total costs and expenses Income from operations Interest and other income, net Income before income taxes Provision for income taxes Net income Net income per share of Class A and Class B common stock: Basic Diluted Net income Other comprehensive income (loss): Change in foreign currency translation adjustment Available-for-sale investments: Cash flow hedges: Change in unrealized gains Less: reclassification adjustment for gains included in net income Net change (net of tax effect of $138, $52, $2) Year Ended December 31, 2010 2009 $23,651 Change in net unrealized gains Less: reclassification adjustment for net gains included in net income Net change (net of tax effect of $6, $52, $54) Other comprehensive income (loss) Comprehensive income 8,844 2,843 1,984 1,668 0 15,339 8,312 69 8,381 1,861 $ 6,520 Google Inc. CONSOLIDATED STATEMENTS OF COMPREHENSIVE INCOME (In millions) $ 20.62 $ 20.41 2009 $6,520 77 $29,321 $37.905 93 (91) 2 10,417 13,188 3,762 5,162 2,799 4,589 1,962 2,724 (9) (192) (201) 0 18,940 10,381 415 10,796 2,291 $ 8,505 $ 26.69 $ 26.31 Year Ended December 31, 2010 2011 $8,505 $9,737 (124) (107) 232 (151) 81 196 (120) 76 500 26,163 11,742 584 12,326 2,589 $ 9,737 (122) 33 $6,398 $8,538 $ 30.17 $ 29.76 348 (115) 233 (27) 12 138 $9,875 Google Inc. CONSOLIDATED STATEMENTS OF STOCKHOLDERS' EQUITY (In millions, except for share amounts, which are reflected in thousands) Balance at January 1, 2009 Common stock issued Stock-based compensation expense Stock-based compensation tax benefits Tax withholding related to vesting of restricted stock units Net income Other comprehensive loss Balance at December 31, 2009 Common stock issued Common stock repurchased Stock-based compensation expense Stock-based compensation tax benefits Tax withholding related to vesting of restricted stock units Net income Other comprehensive income Balance at December 31, 2010 Common stock issued Stock-based compensation expense Stock-based compensation tax benefits Tax withholding related to vesting of restricted stock units Net income Other comprehensive income Balance at December 31, 2011 Class A and Class B Common Stock and Additional Paid-In Capital Shares Amount 315,114 $ 14,450 2,658 350 317,772 5,126 (1,597) 321,301 3,594 1,164 60 (207) 0 0 15,817 1,412 (82) 1.376 72 (360) 0 Accumulated Other Comprehensive Income 18,235 621 1,974 60 (626) 0 0 324,895 $ 20,264 $ 227 0 0 0 0 oc 0 (122) 105 0 0 0 0 0 0 33 138 0 0 0 0 0 138 276 Retained Eamings $13,562 0 0 0 0 6,520 0 20,082 0 (719) 0 0 0 8,505 27,868 0 0 0 0 9,737 0 $37,605 Total Stockholders Equity $ 28,239 350 1,164 60 (207) 6,520 (122) 36.004 1,412 (801) 1,376 72 (360) 8,505 33 46,241 621 1,974 60 (626) 9,737 138 $ 58,145 Operating activities Net income Adjustments: Google Inc. CONSOLIDATED STATEMENTS OF CASH FLOWS (In millions) Depreciation and amortization of property and equipment Amortization of intangible and other assets Stock-based compensation expense Excess tax benefits from stock-based award activities Deferred income taxes Impairment of equity investments Other Changes in assets and liabilities, net of effects of acquisitions: Accounts receivable Income taxes, net Prepaid revenue share, expenses and other assets Accounts payable Accrued expenses and other liabilities Accrued revenue share Deferred revenue Net cash provided by operating activities Investing activities Purchases of property and equipment Purchases of marketable securities Maturities and sales of marketable securities Investments in non-marketable equity securities Cash collateral received (returned) from securities lending Investments in reverse repurchase agreements Acquisitions, net of cash acquired, and purchases of intangible and other assets Net cash used in investing activities Financing activities Net proceeds (payments) from stock-based award activities Excess tax benefits from stock-based award activities Repurchase of common stock Proceeds from issuance of debt, net of costs Repayment of debt Net cash provided by financing activities Effect of exchange rate changes on cash and cash equivalents Net increase (decrease) in cash and cash equivalents Cash and cash equivalents at beginning of year Cash and cash equivalents at end of year Supplemental disclosures of cash flow information Cash paid for interest Cash paid for taxes Non-cash financing activity: Fair value of common stock issued and vested options assumed in connection with acquisitions See accompanying notes. Year Ended December 31, 2010 $ 6,520 1,240 284 1,164 (90) (268) 0 (20) (504) 217 262 34 243 158 76 9,316 (810) (29,139) 22,103 (65) 0 0 (108) (8,019) 143 90 0 0 0 233 11 1,541 8,657 $ 10,198 0 $ $ 1,896 $ 8,505 1,067 329 1,376 (94) 9 0 (12) (1,129) 102 (414) 272 745 214 111 11,081 (4,018) (43,985) 37.099 $0 $ (320) 2,361 (750) (1,067) (10,680) 294 94 (801) 5,246 (1,783) 3,050 (19) 3,432 10,198 $ 13,630 0 $ $ 2,175 750 2011 $ 9,737 1,396 455 1,974 (86) 343 110 6 (1,156) 731 (262) 101 795 259 162 14,565 (3,438) (61,672) 48,746 (428) (354) 5 (1,900) (19,041) (5) 86 0 10,905 (10,179) 807 22 (3,647) 13,630 $ 9,983 $ 40 $ 1,471 $ 0 Google Inc. NOTES TO CONSOLIDATED FINANCIAL STATEMENTS Note 1. Google Inc. and Summary of Significant Accounting Policies Nature of Operations We were incorporated in California in September 1998. We were re-incorporated in the State of Delaware in August 2003. We generate revenues primarily by delivering relevant, cost-effective online advertising. Software Development Costs We expense software development costs, including costs to develop software products or the software component of products to be marketed to external users, before technological feasibility of such products is reached. We have determined that technological feasibility was reached shortly before the release of those products and as a result, the development costs incurred after the establishment of technological feasibility and before the release of those products were not material, and accordingly, were expensed as incurred. Note 9. Goodwill and Other Intangible Assets The changes in the carrying amount of goodwill for the year ended December 31, 2011 were as follows (in millions): Balance as of December 31, 2010 Goodwill acquired Goodwill adjustment Balance as of December 31, 2011 Information regarding our acquisition-related intangible assets is as follows (in millions): As of December 31, 2010 Accumulated Amortization Patents and developed technology Customer relationships Trade names and other Total Patents and developed technology Customer relationships Trade names and other Total 2012 2013 2014 2015 2016 Thereafter Gross Carrying Amount $ 915 950 283 Foreign currency translation adjustment Net unrealized gains on available-for-sale investments, net of taxes Unrealized gains on cash flow hedges, net of taxes Accumulated other comprehensive income $2,148 Gross Carrying Amount $1,451 1,288 359 $3,098 $ 506 400 198 $ 1,104 As of December 31, 2011 Accumulated Amortization $ 698 573 249 $ 1.520 Note 11. Accumulated Other Comprehensive Income The components of accumulated other comprehensive income are as follows (in millions): $6,256 1,118 (28) $7,346 $ (41) 94 85 $ 138 Net Carrying Value Patents and developed technology, customer relationships, and trade names and other have weighted-average useful lives from the date of purchase of 5.0 years, 6.1 years, and 4.3 years. Amortization expense of acquisition-related intangible assets for the years ended December 31, 2009, 2010, and 2011 was $266 million, $314 million, and $441 million. As of December 31, 2011, expected amortization expense for acquisition-related intangible assets for each of the next five years and thereafter was as follows (in millions): $ 409 550 85 $1,044 Net Carrying Value $ 753 715 110 $1,578 $ 472 364 297 147 99 199 $1,578 As of December 31, 2010 2011 S (148) 327 97 $ 276 Note 13. Stockholders' Equity Convertible Preferred Stock Our board of directors has authorized 100,000,000 shares of convertible preferred stock, $0.001 par value, issuable in series. At December 31, 2010 and December 31, 2011, there were no shares issued or outstanding. Class A and Class B Common Stock Our board of directors has authorized two classes of common stock, Class A and Class B. At December 31, 2011, there were 6,000,000,000 and 3,000,000,000 shares authorized and there were 257,552,401 and 67,342,362 shares outstanding of Class A and Class B common stock. The rights of the holders of Class A and Class B common stock are identical, except with respect to voting. Each share of Class A common stock is entitled to one vote per share. Each share of Class B common stock is entitled to 10 votes per share. Shares of Class B common stock may be converted at any time at the option of the stockholder and automatically convert upon sale or transfer to Class A common stock. We refer to Class A and Class B common stock as common stock throughout the notes to these financial statements, unless otherwise noted. The following is an excerpt from Google's quarterly report for the second quarter of 2012: Note 8. Acquisitions On May 22, 2012, we completed our acquisition of Motorola, a provider of innovative technologies, products and services that enable a range of mobile and wireline digital communication, information and entertainment experiences. The acquisition is expected to protect and advance our Android ecosystem and enhance competition in mobile computing. Under the transaction, we acquired all outstanding common shares of Motorola for $40 per share and all vested Motorola stock options and restricted stock units, for a total purchase price of approximately $12.4 billion in cash. Of the $12.4 billion total purchase price, $2.9 billion was cash acquired, $5.5 billion was attributed to patents and developed technology, $2.6 billion to goodwill, $730 million to customer relationships, $2,870 million to other tangible assets acquired, and $2.2 billion of liabilities assumed. The goodwill of $2.6 billion is primarily attributed to the synergies expected to arise after the acquisition. Suppose Google had acquired Motorola by issuing shares instead of paying cash. Would Total Stockholders' equity as of the date of the acquisition, May 22, 2012 have been higher than, lower than or the same as currently reported? If different, by how much? Higher If higher/lower, by how much Lower The Same Google Inc. CONSOLIDATED BALANCE SHEETS (In millions, except share and par value amounts which are reflected in thousands, and par value per share amounts) Assets Current assets: Cash and cash equivalents Marketable securities Total cash, cash equivalents, and marketable securities Accounts receivable, net of allowance of $101 and $133 Receivable under reverse repurchase agreements Deferred income taxes, net Prepaid revenue share, expenses and other assets Total current assets Prepaid revenue share, expenses and other assets, non-current Deferred income taxes, net, non-current Non-marketable equity securities Property and equipment, net Intangible assets, net Goodwill Total assets Liabilities and Stockholders' Equity Current liabilities: Accounts payable Short-term debt Accrued compensation and benefits Accrued expenses and other current liabilities Accrued revenue share Securities lending payable Deferred revenue Income taxes payable, net Total current liabilities Long-term debt Deferred revenue, non-current Income taxes payable, non-current Deferred income taxes, net, non-current Other long-term liabilities Commitments and contingencies Stockholders' equity: Convertible preferred stock, $0.001 par value per share, 100,000 shares authorized; no shares issued and outstanding Class A and Class B common stock and additional paid-in capital, $0.001 par value per share: 9,000,000 shares authorized: 321,301 (Class A 250,413, Class B 70,888) and par value of $321 (Class A $250, Class B $71) and 324,895 (Class A 257,553, Class B 67,342) and par value of $325 (Class A $258, Class B $67) shares issued and outstanding Accumulated other comprehensive income Retained earnings Total stockholders' equity Total liabilities and stockholders' equity As of December 31, 2010 $ 13.630 21,345 34,975 4,252 750 259 $ 1,326 41,562 442 265 523 7,759 1,044 6,256 $ 57,851 483 3,465 1,410 961 885 2,361 394 37 9,996 0 35 1,200 0 379 18,235 138 27,868 46,241 $ 57,851 As of December 31, 2011 $ 9.983 34,643 44,626 5,427 745 215 1,745 $ 52,758 499 0 790 9,603 1,578 7,346 $ 72,574 588 1,218 1,818 1.370 1,168 2,007 547 197 8,913 2,986 44 1,693 287 506 0 20,264 276 37,605 58,145 $ 72,574 Revenues Costs and expenses: Cost of revenues (including stock-based compensation expense of $47, $67, $249) Research and development (including stock-based compensation expense of $725, $861, $1,061) Sales and marketing (including stock-based compensation expense of $231, $261, $361) Google Inc. CONSOLIDATED STATEMENTS OF INCOME (In millions, except per share amounts) General and administrative (including stock-based compensation expense of $161, $187, $303) Charge related to the resolution of Department of Justice investigation Total costs and expenses Income from operations Interest and other income, net Income before income taxes Provision for income taxes Net income Net income per share of Class A and Class B common stock: Basic Diluted Net income Other comprehensive income (loss): Change in foreign currency translation adjustment Available-for-sale investments: Cash flow hedges: Change in unrealized gains Less: reclassification adjustment for gains included in net income Net change (net of tax effect of $138, $52, $2) Year Ended December 31, 2010 2009 $23,651 Change in net unrealized gains Less: reclassification adjustment for net gains included in net income Net change (net of tax effect of $6, $52, $54) Other comprehensive income (loss) Comprehensive income 8,844 2,843 1,984 1,668 0 15,339 8,312 69 8,381 1,861 $ 6,520 Google Inc. CONSOLIDATED STATEMENTS OF COMPREHENSIVE INCOME (In millions) $ 20.62 $ 20.41 2009 $6,520 77 $29,321 $37.905 93 (91) 2 10,417 13,188 3,762 5,162 2,799 4,589 1,962 2,724 (9) (192) (201) 0 18,940 10,381 415 10,796 2,291 $ 8,505 $ 26.69 $ 26.31 Year Ended December 31, 2010 2011 $8,505 $9,737 (124) (107) 232 (151) 81 196 (120) 76 500 26,163 11,742 584 12,326 2,589 $ 9,737 (122) 33 $6,398 $8,538 $ 30.17 $ 29.76 348 (115) 233 (27) 12 138 $9,875 Google Inc. CONSOLIDATED STATEMENTS OF STOCKHOLDERS' EQUITY (In millions, except for share amounts, which are reflected in thousands) Balance at January 1, 2009 Common stock issued Stock-based compensation expense Stock-based compensation tax benefits Tax withholding related to vesting of restricted stock units Net income Other comprehensive loss Balance at December 31, 2009 Common stock issued Common stock repurchased Stock-based compensation expense Stock-based compensation tax benefits Tax withholding related to vesting of restricted stock units Net income Other comprehensive income Balance at December 31, 2010 Common stock issued Stock-based compensation expense Stock-based compensation tax benefits Tax withholding related to vesting of restricted stock units Net income Other comprehensive income Balance at December 31, 2011 Class A and Class B Common Stock and Additional Paid-In Capital Shares Amount 315,114 $ 14,450 2,658 350 317,772 5,126 (1,597) 321,301 3,594 1,164 60 (207) 0 0 15,817 1,412 (82) 1.376 72 (360) 0 Accumulated Other Comprehensive Income 18,235 621 1,974 60 (626) 0 0 324,895 $ 20,264 $ 227 0 0 0 0 oc 0 (122) 105 0 0 0 0 0 0 33 138 0 0 0 0 0 138 276 Retained Eamings $13,562 0 0 0 0 6,520 0 20,082 0 (719) 0 0 0 8,505 27,868 0 0 0 0 9,737 0 $37,605 Total Stockholders Equity $ 28,239 350 1,164 60 (207) 6,520 (122) 36.004 1,412 (801) 1,376 72 (360) 8,505 33 46,241 621 1,974 60 (626) 9,737 138 $ 58,145 Operating activities Net income Adjustments: Google Inc. CONSOLIDATED STATEMENTS OF CASH FLOWS (In millions) Depreciation and amortization of property and equipment Amortization of intangible and other assets Stock-based compensation expense Excess tax benefits from stock-based award activities Deferred income taxes Impairment of equity investments Other Changes in assets and liabilities, net of effects of acquisitions: Accounts receivable Income taxes, net Prepaid revenue share, expenses and other assets Accounts payable Accrued expenses and other liabilities Accrued revenue share Deferred revenue Net cash provided by operating activities Investing activities Purchases of property and equipment Purchases of marketable securities Maturities and sales of marketable securities Investments in non-marketable equity securities Cash collateral received (returned) from securities lending Investments in reverse repurchase agreements Acquisitions, net of cash acquired, and purchases of intangible and other assets Net cash used in investing activities Financing activities Net proceeds (payments) from stock-based award activities Excess tax benefits from stock-based award activities Repurchase of common stock Proceeds from issuance of debt, net of costs Repayment of debt Net cash provided by financing activities Effect of exchange rate changes on cash and cash equivalents Net increase (decrease) in cash and cash equivalents Cash and cash equivalents at beginning of year Cash and cash equivalents at end of year Supplemental disclosures of cash flow information Cash paid for interest Cash paid for taxes Non-cash financing activity: Fair value of common stock issued and vested options assumed in connection with acquisitions See accompanying notes. Year Ended December 31, 2010 $ 6,520 1,240 284 1,164 (90) (268) 0 (20) (504) 217 262 34 243 158 76 9,316 (810) (29,139) 22,103 (65) 0 0 (108) (8,019) 143 90 0 0 0 233 11 1,541 8,657 $ 10,198 0 $ $ 1,896 $ 8,505 1,067 329 1,376 (94) 9 0 (12) (1,129) 102 (414) 272 745 214 111 11,081 (4,018) (43,985) 37.099 $0 $ (320) 2,361 (750) (1,067) (10,680) 294 94 (801) 5,246 (1,783) 3,050 (19) 3,432 10,198 $ 13,630 0 $ $ 2,175 750 2011 $ 9,737 1,396 455 1,974 (86) 343 110 6 (1,156) 731 (262) 101 795 259 162 14,565 (3,438) (61,672) 48,746 (428) (354) 5 (1,900) (19,041) (5) 86 0 10,905 (10,179) 807 22 (3,647) 13,630 $ 9,983 $ 40 $ 1,471 $ 0 Google Inc. NOTES TO CONSOLIDATED FINANCIAL STATEMENTS Note 1. Google Inc. and Summary of Significant Accounting Policies Nature of Operations We were incorporated in California in September 1998. We were re-incorporated in the State of Delaware in August 2003. We generate revenues primarily by delivering relevant, cost-effective online advertising. Software Development Costs We expense software development costs, including costs to develop software products or the software component of products to be marketed to external users, before technological feasibility of such products is reached. We have determined that technological feasibility was reached shortly before the release of those products and as a result, the development costs incurred after the establishment of technological feasibility and before the release of those products were not material, and accordingly, were expensed as incurred. Note 9. Goodwill and Other Intangible Assets The changes in the carrying amount of goodwill for the year ended December 31, 2011 were as follows (in millions): Balance as of December 31, 2010 Goodwill acquired Goodwill adjustment Balance as of December 31, 2011 Information regarding our acquisition-related intangible assets is as follows (in millions): As of December 31, 2010 Accumulated Amortization Patents and developed technology Customer relationships Trade names and other Total Patents and developed technology Customer relationships Trade names and other Total 2012 2013 2014 2015 2016 Thereafter Gross Carrying Amount $ 915 950 283 Foreign currency translation adjustment Net unrealized gains on available-for-sale investments, net of taxes Unrealized gains on cash flow hedges, net of taxes Accumulated other comprehensive income $2,148 Gross Carrying Amount $1,451 1,288 359 $3,098 $ 506 400 198 $ 1,104 As of December 31, 2011 Accumulated Amortization $ 698 573 249 $ 1.520 Note 11. Accumulated Other Comprehensive Income The components of accumulated other comprehensive income are as follows (in millions): $6,256 1,118 (28) $7,346 $ (41) 94 85 $ 138 Net Carrying Value Patents and developed technology, customer relationships, and trade names and other have weighted-average useful lives from the date of purchase of 5.0 years, 6.1 years, and 4.3 years. Amortization expense of acquisition-related intangible assets for the years ended December 31, 2009, 2010, and 2011 was $266 million, $314 million, and $441 million. As of December 31, 2011, expected amortization expense for acquisition-related intangible assets for each of the next five years and thereafter was as follows (in millions): $ 409 550 85 $1,044 Net Carrying Value $ 753 715 110 $1,578 $ 472 364 297 147 99 199 $1,578 As of December 31, 2010 2011 S (148) 327 97 $ 276 Note 13. Stockholders' Equity Convertible Preferred Stock Our board of directors has authorized 100,000,000 shares of convertible preferred stock, $0.001 par value, issuable in series. At December 31, 2010 and December 31, 2011, there were no shares issued or outstanding. Class A and Class B Common Stock Our board of directors has authorized two classes of common stock, Class A and Class B. At December 31, 2011, there were 6,000,000,000 and 3,000,000,000 shares authorized and there were 257,552,401 and 67,342,362 shares outstanding of Class A and Class B common stock. The rights of the holders of Class A and Class B common stock are identical, except with respect to voting. Each share of Class A common stock is entitled to one vote per share. Each share of Class B common stock is entitled to 10 votes per share. Shares of Class B common stock may be converted at any time at the option of the stockholder and automatically convert upon sale or transfer to Class A common stock. We refer to Class A and Class B common stock as common stock throughout the notes to these financial statements, unless otherwise noted. The following is an excerpt from Google's quarterly report for the second quarter of 2012: Note 8. Acquisitions On May 22, 2012, we completed our acquisition of Motorola, a provider of innovative technologies, products and services that enable a range of mobile and wireline digital communication, information and entertainment experiences. The acquisition is expected to protect and advance our Android ecosystem and enhance competition in mobile computing. Under the transaction, we acquired all outstanding common shares of Motorola for $40 per share and all vested Motorola stock options and restricted stock units, for a total purchase price of approximately $12.4 billion in cash. Of the $12.4 billion total purchase price, $2.9 billion was cash acquired, $5.5 billion was attributed to patents and developed technology, $2.6 billion to goodwill, $730 million to customer relationships, $2,870 million to other tangible assets acquired, and $2.2 billion of liabilities assumed. The goodwill of $2.6 billion is primarily attributed to the synergies expected to arise after the acquisition.
Expert Answer:
Answer rating: 100% (QA)
Detailed Explanation The question is asking about the impact on Googles Total Stockholders Equity if the company had acquired Motorola by issuing shar... View the full answer

Related Book For 
Intermediate Accounting
ISBN: 978-0470161012
9th Canadian Edition, Volume 2
Authors: Donald E. Kieso, Jerry J. Weygandt, Terry D. Warfield.
Posted Date:
Students also viewed these finance questions
-
The Crazy Eddie fraud may appear smaller and gentler than the massive billion-dollar frauds exposed in recent times, such as Bernie Madoffs Ponzi scheme, frauds in the subprime mortgage market, the...
-
Read the case study "Southwest Airlines," found in Part 2 of your textbook. Review the "Guide to Case Analysis" found on pp. CA1 - CA11 of your textbook. (This guide follows the last case in the...
-
Cancer is a frightening disease. The biological process that creates cancerous cells from healthy tissue is poorly understood at best. Much research has been conducted into how external conditions...
-
The financial statements of adidas (DEU) and Puma (DEU) are presented in Appendices B and C, respectively. The complete annual reports, including the notes to the financial statements, are available...
-
Prepare journal entries to record the following sales transactions in Trig Companys books. Trig uses a perpetual inventory system and the contract-based approach to revenue recognition. Management...
-
The Cooper Furniture Company of Potomac, Maryland, assembles two types of chairs (Recliners and Rockers). Separate assembly lines are used for each type of chair. Classify each cost item (AI) as...
-
Overton Company has gathered the following information. Units in beginning work in process ....... 20,000 Units started into production ......... 164,000 Units in ending work in process ..........
-
An aluminum-alloy rod has a length of 9.2293 cm at 20.00C and a length of 9.2767 cm at the boiling point of water. (a) What is the length of the rod at the freezing point of water? (b) What is the...
-
A venturi meter similar to the one in Fig. 15.2 is attached to a 4-in Schedule 40 steel pipe and has a throat diameter of 1.50 in. Determine the pressure difference across the meter that would be...
-
Question 1: (13.0 points) A simplified flowsheet for the manufacture of sugar is shown below. Sugarcane is fed to the mill, where a syrup is squeezed out, and the resulting "bagasse" contains 80%...
-
Why does the auditor always investigate control exceptions?
-
Which auditing standard sets the minimum level of documentation required in the working papers stored in the audit files?
-
What is the impact on the extent of required substantive testing if inherent risk is high and no assurance has been obtained from controls testing
-
Why does the Critical Chain methodology claim that individual tasks cannot be protected by inflated estimates or due dates? How does buffering a project and feeding paths provide greater...
-
Why is it preferred that most communications with those charged with governance be done in writing?
-
Report is... Select one: a. Informational work b. Pass time work c. Introductional work d. Professional work
-
One of the significant and relevant accounts for this cycle is equipment. For this account, what would typically be the most relevant assertions for the auditor to consider? Why is it important for...
-
MacAskill Mills Limited, which uses ASPE, engaged in the following transactions in 2011. 1. The Land account increased by $58,000 over the year: Land that originally cost $60,000 was exchanged along...
-
Saver Corporation amended its defined benefit pension plan at the beginning of its 2011 fiscal year, resulting in past service costs of $775,000. The vesting period for Saver Corporation is seven...
-
Goodwin Corp., which began operations in January 2008, follows IFRS and is subject to a 40% income tax rate. In 2011, the following events took place: 1. The company switched from the zero-profit...
-
The global market presents firms with more complex ethical issues than they would experience if operations were limited to one country and one culture. Moral standards vary across cultures. In some...
-
Bhopal is a city in central India with a population, in 1984 , of 800,000 . Because it was, at that time, home to the largest mosque in India, Bhopal was a major railway junction. Its main industries...
-
PricewaterhouseCoopers (or PwC, as it is known), one of the United States' "Big 4" accounting firms, has had a tax practice in Russia since the time that country changed from Communist rule. One of...

Study smarter with the SolutionInn App