

Suppose that you begin planning your investments on your 40th birthday (the sooner you start, the...
Fantastic news! We've Found the answer you've been seeking!
Question:
Transcribed Image Text:
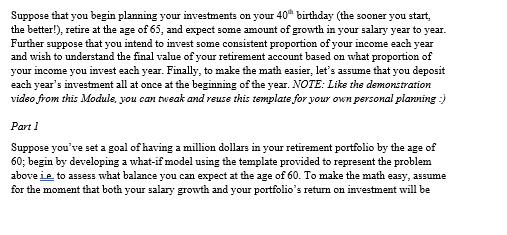
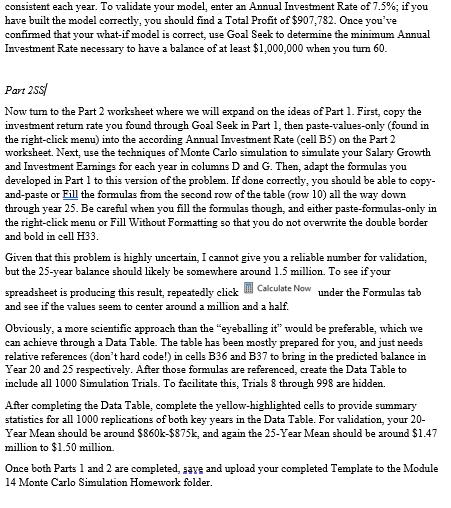
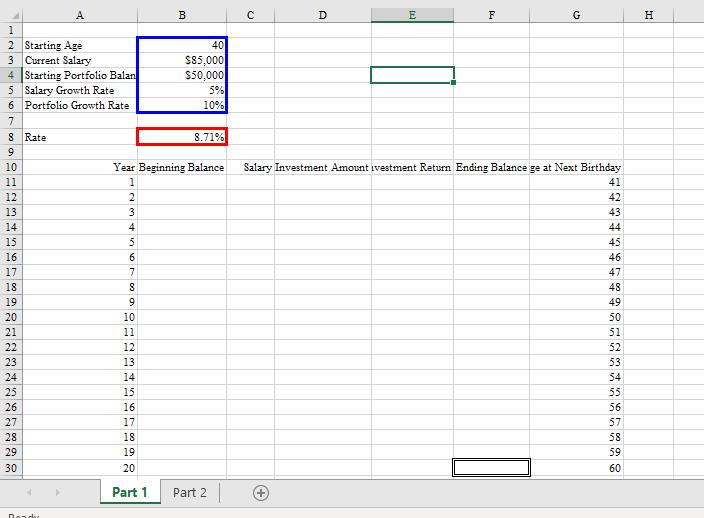
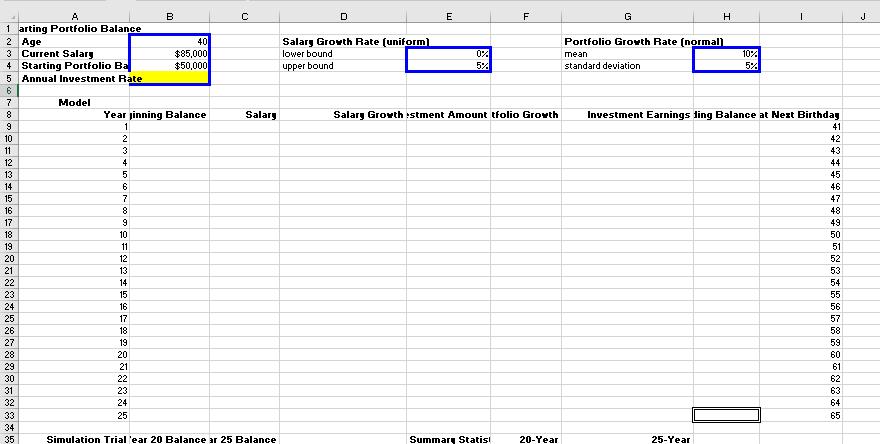
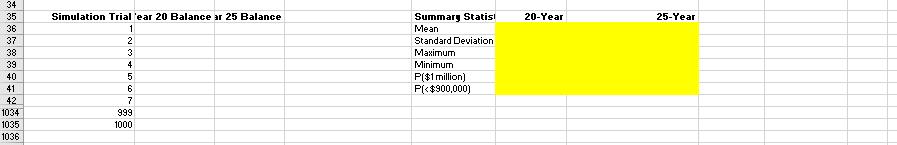
Suppose that you begin planning your investments on your 40th birthday (the sooner you start, the better!), retire at the age of 65, and expect some amount of growth in your salary year to year. Further suppose that you intend to invest some consistent proportion of your income each year and wish to understand the final value of your retirement account based on what proportion of your income you invest each year. Finally, to make the math easier, let's assume that you deposit each year's investment all at once at the beginning of the year. NOTE: Like the demonstration video from this Module, you can tweak and reuse this template for your own personal planning :) Part 1 Suppose you've set a goal of having a million dollars in your retirement portfolio by the age of 60; begin by developing a what-if model using the template provided to represent the problem above je to assess what balance you can expect at the age of 60. To make the math easy, assume for the moment that both your salary growth and your portfolio's return on investment will be consistent each year. To validate your model, enter an Annual Investment Rate of 7.5%; if you have built the model correctly, you should find a Total Profit of $907,782. Once you've confirmed that your what-if model is correct, use Goal Seek to determine the minimum Annual Investment Rate necessary to have a balance of at least $1,000,000 when you turn 60. Part 2SS/ Now turn to the Part 2 worksheet where we will expand on the ideas of Part 1. First, copy the investment return rate you found through Goal Seek in Part 1, then paste-values-only (found in the right-click menu) into the according Annual Investment Rate (cell B5) on the Part 2 worksheet. Next, use the techniques of Monte Carlo simulation to simulate your Salary Growth and Investment Earnings for each year in columns D and G. Then, adapt the formulas you developed in Part 1 to this version of the problem. If done correctly, you should be able to copy- and-paste or Fill the formulas from the second row of the table (row 10) all the way down through year 25. Be careful when you fill the formulas though, and either paste-formulas-only in the right-click menu or Fill Without Formatting so that you do not overwrite the double border and bold in cell H33. Given that this problem is highly uncertain, I cannot give you a reliable number for validation, but the 25-year balance should likely be somewhere around 1.5 million. To see if your spreadsheet is producing this result, repeatedly click Calculate Now under the Formulas tab and see if the values seem to center around a million and a half. Obviously, a more scientific approach than the "eyeballing it" would be preferable, which we can achieve through a Data Table. The table has been mostly prepared for you, and just needs relative references (don't hard code!) in cells B36 and B37 to bring in the predicted balance in Year 20 and 25 respectively. After those formulas are referenced, create the Data Table to include all 1000 Simulation Trials. To facilitate this, Trials 8 through 998 are hidden. After completing the Data Table, complete the yellow-highlighted cells to provide summary statistics for all 1000 replications of both key years in the Data Table. For validation, your 20- Year Mean should be around $860k-$875k, and again the 25-Year Mean should be around $1.47 million to $1.50 million. Once both Parts 1 and 2 are completed, save and upload your completed Template to the Module 14 Monte Carlo Simulation Homework folder. 1 INMANGR0022222222982888388888 2 Starting Age 3 Current Salary 4 Starting Portfolio Balan 5 Salary Growth Rate 6 Portfolio Growth Rate 7 8 Rate 10 11 12 13 14 15 16 17 18 19 21 24 25 26 A 27 Roadu 34 4 6678a 5 Year Beginning Balance 1 2 9 10 11 12 13 B 14 15 bd 40 $85,000 $50,000 5% 10% 8.71% 16 17 18 19 20 Part 1 Part 2 с D E F G Salary Investment Amount ivestment Return Ending Balance ge at Next Birthday W H 2 3 4 5 6 7 48 49 50 1234567 58 59 41 42 43 44 46 47 55 60 H A 1 arting Portfolio Balance 2 Age 3 Current Salary 4 Starting Portfolio Ba 5 Annual Investment Rate 6 OFESSIC22&~~~~~~88852838 6789mnN侣体仍旧仅旧旧0123 24 25 7 9 10 11 12 13 14 15 16 17 18 19 20 21 24 26 27 29 30 31 33 34 Model 3 4 Year jinning Balance 1 2 5 11 14 15 00 22 40 $85,000 $50,000 C Salary Simulation Trial 'ear 20 Balance ar 25 Balance D Salarg Growth Rate (uniform] lower bound upper bound E 0% 5% F Salary Growth stment Amount tfolio Growth Summary Statis 20-Year H Portfolio Growth Rate (normal) mean standard deviation 25-Year 10% 5% I Investment Earnings ling Balance at Next Birthday 41 42 43 44 45 46 47 48 49 50 51 52 53 54 55 56 57 58 59 60 61 62 63 64 65 J 34 35 36 37 38 39 40 41 42 1034 1035 1036 Simulation Trial 'ear 20 Balance ar 25 Balance 1 2 3 4 5 6 7 999 1000 Summary Statis! Mean Standard Deviation Maximum Minimum P($1 million) P(<$900,000) 20-Year 25-Year Suppose that you begin planning your investments on your 40th birthday (the sooner you start, the better!), retire at the age of 65, and expect some amount of growth in your salary year to year. Further suppose that you intend to invest some consistent proportion of your income each year and wish to understand the final value of your retirement account based on what proportion of your income you invest each year. Finally, to make the math easier, let's assume that you deposit each year's investment all at once at the beginning of the year. NOTE: Like the demonstration video from this Module, you can tweak and reuse this template for your own personal planning :) Part 1 Suppose you've set a goal of having a million dollars in your retirement portfolio by the age of 60; begin by developing a what-if model using the template provided to represent the problem above je to assess what balance you can expect at the age of 60. To make the math easy, assume for the moment that both your salary growth and your portfolio's return on investment will be consistent each year. To validate your model, enter an Annual Investment Rate of 7.5%; if you have built the model correctly, you should find a Total Profit of $907,782. Once you've confirmed that your what-if model is correct, use Goal Seek to determine the minimum Annual Investment Rate necessary to have a balance of at least $1,000,000 when you turn 60. Part 2SS/ Now turn to the Part 2 worksheet where we will expand on the ideas of Part 1. First, copy the investment return rate you found through Goal Seek in Part 1, then paste-values-only (found in the right-click menu) into the according Annual Investment Rate (cell B5) on the Part 2 worksheet. Next, use the techniques of Monte Carlo simulation to simulate your Salary Growth and Investment Earnings for each year in columns D and G. Then, adapt the formulas you developed in Part 1 to this version of the problem. If done correctly, you should be able to copy- and-paste or Fill the formulas from the second row of the table (row 10) all the way down through year 25. Be careful when you fill the formulas though, and either paste-formulas-only in the right-click menu or Fill Without Formatting so that you do not overwrite the double border and bold in cell H33. Given that this problem is highly uncertain, I cannot give you a reliable number for validation, but the 25-year balance should likely be somewhere around 1.5 million. To see if your spreadsheet is producing this result, repeatedly click Calculate Now under the Formulas tab and see if the values seem to center around a million and a half. Obviously, a more scientific approach than the "eyeballing it" would be preferable, which we can achieve through a Data Table. The table has been mostly prepared for you, and just needs relative references (don't hard code!) in cells B36 and B37 to bring in the predicted balance in Year 20 and 25 respectively. After those formulas are referenced, create the Data Table to include all 1000 Simulation Trials. To facilitate this, Trials 8 through 998 are hidden. After completing the Data Table, complete the yellow-highlighted cells to provide summary statistics for all 1000 replications of both key years in the Data Table. For validation, your 20- Year Mean should be around $860k-$875k, and again the 25-Year Mean should be around $1.47 million to $1.50 million. Once both Parts 1 and 2 are completed, save and upload your completed Template to the Module 14 Monte Carlo Simulation Homework folder. 1 INMANGR0022222222982888388888 2 Starting Age 3 Current Salary 4 Starting Portfolio Balan 5 Salary Growth Rate 6 Portfolio Growth Rate 7 8 Rate 10 11 12 13 14 15 16 17 18 19 21 24 25 26 A 27 Roadu 34 4 6678a 5 Year Beginning Balance 1 2 9 10 11 12 13 B 14 15 bd 40 $85,000 $50,000 5% 10% 8.71% 16 17 18 19 20 Part 1 Part 2 с D E F G Salary Investment Amount ivestment Return Ending Balance ge at Next Birthday W H 2 3 4 5 6 7 48 49 50 1234567 58 59 41 42 43 44 46 47 55 60 H A 1 arting Portfolio Balance 2 Age 3 Current Salary 4 Starting Portfolio Ba 5 Annual Investment Rate 6 OFESSIC22&~~~~~~88852838 6789mnN侣体仍旧仅旧旧0123 24 25 7 9 10 11 12 13 14 15 16 17 18 19 20 21 24 26 27 29 30 31 33 34 Model 3 4 Year jinning Balance 1 2 5 11 14 15 00 22 40 $85,000 $50,000 C Salary Simulation Trial 'ear 20 Balance ar 25 Balance D Salarg Growth Rate (uniform] lower bound upper bound E 0% 5% F Salary Growth stment Amount tfolio Growth Summary Statis 20-Year H Portfolio Growth Rate (normal) mean standard deviation 25-Year 10% 5% I Investment Earnings ling Balance at Next Birthday 41 42 43 44 45 46 47 48 49 50 51 52 53 54 55 56 57 58 59 60 61 62 63 64 65 J 34 35 36 37 38 39 40 41 42 1034 1035 1036 Simulation Trial 'ear 20 Balance ar 25 Balance 1 2 3 4 5 6 7 999 1000 Summary Statis! Mean Standard Deviation Maximum Minimum P($1 million) P(<$900,000) 20-Year 25-Year
Expert Answer:
Answer rating: 100% (QA)
Introduction The events surrounding the killing of George Floyd in 2020 ignited widespread protests and discussions about systemic racism and discrimination particularly within law enforcement In resp... View the full answer

Related Book For 
Managerial accounting
ISBN: 978-0471467854
1st edition
Authors: ramji balakrishnan, k. s i varamakrishnan, Geoffrey b. sprin
Posted Date:
Students also viewed these human resource management questions
-
Planning is one of the most important management functions in any business. A front office managers first step in planning should involve determine the departments goals. Planning also includes...
-
The Crazy Eddie fraud may appear smaller and gentler than the massive billion-dollar frauds exposed in recent times, such as Bernie Madoffs Ponzi scheme, frauds in the subprime mortgage market, the...
-
Managing Scope Changes Case Study Scope changes on a project can occur regardless of how well the project is planned or executed. Scope changes can be the result of something that was omitted during...
-
Alexa owns a condominium near Cocoa Beach in Florida. In 2022, she incurs the following expenses in connection with her condo: Insurance $ 3,900 Mortgage interest 10,700 Property taxes 3,000 Repairs...
-
Would it be possible for firms to calculate their maximum-profit output if they did not use marginal cost and marginal revenue concepts?
-
(a) Making use of Eqs. (11.15) and (11.16), written for excess properties, show for a binary system that: Where M ¡ ME / x1x2 (b) Plot on a single graph the values of HE/x1x2, HE1, and H1E/:...
-
Information from Goddard Picture Frames cash account as well as the January bank statement is presented next. Requirements 1. Prepare the bank reconciliation on January 31. 2. Prepare all necessary...
-
Is there a difference in the variation of the yields of different types of investments? The file CD Rate contains the yields for one- year certificates of deposit (CDs) and five- year CDs for 22...
-
What type of parenting approach (portfolio, synergy, or development) can better explain and help understand what Alphabet is doing? Why
-
In the investment world, commodities are typically pretty boring. From livestock to grains to steel and other metals, commodities have their ups and downs. But long term, the world will always need...
-
The Fund Management Industry is a traditional and conservative industry that for decades has lagged behind the digital advances made in the banking industry and related retail investment management....
-
Statistical connections between the values a. Correlation functions in an experiment b. Nonstationary process c. Sample space of \(x(t)\) at times \(t_{1}, t_{2}, \ldots\) d. White noise of the time...
-
Fill in the Blank. Univariate distributions describe the probability distributions of __________ random variables.
-
Fill in the Blank. A string has the same relationship to a beam as a membrane bears to a(n) ____________.
-
Fill in the Blank. If \(S(\overline{\omega)}\) has significant values over a wide range of frequencies, the process is called \(\mathrm{a}(\mathrm{n})\) _____________ process.
-
Verify that the following equation exhibits chaotic behavior: \[x_{n+1}=k x_{n}\left(1-x_{n} ight)\]
-
_ _ _ _ m a r k e t i n g r e l i e s o n w o r d o f m o u t h t o b u i l d m o m e n t u m a n d i n t e r e s t f o r a a p r o d u c t o r i d e a . N i c h e S o c i a l B u z z ...
-
The vapor pressure of the liquid NH, is measured at different temperatures. The following vapor pressure data are obtained. Temperature, K P, mmHg 217.1 223.4 234.7 588.1 Calculate the enthalpy of...
-
The Consummate Consulting Company (CCC) offers a range of consulting services, grouped into Strategic, Technology, Cost, Marketing, and Personnel. The company allocates the cost of supporting...
-
Why might the Department of Defense pay some of its suppliers on a cost-plus basis?
-
Mountain Maples is a mail-order nursery dedicated to growing, selling, and shipping beautiful Japanese Maple trees. Located on a ridge-top in Mendocino County, northern California, Mountain Maples...
-
The Excel formula to compute net income's percentage of sales in Exhibit 7-5, is a. \(=B 4 * B 2\) b. \(=B 4 / B 2\) c. \(=\mathrm{B} 2-\mathrm{B} 3\) d. \(=\mathrm{B} 4+\mathrm{B} 3\) EXHIBIT 7-5 A...
-
Match each component of a computerized accounting system with its meaning. Meaning Component Electronic linkages that allow different computers A. Server to share the same information Electronic...
-
Complete the crossword puzzle that follows. 2 3 4 5 6 Down: 1. Managers need over operations in order to authorize transactions and safeguard assets 3. Programs that drive a computer 4. Electronic...

Study smarter with the SolutionInn App