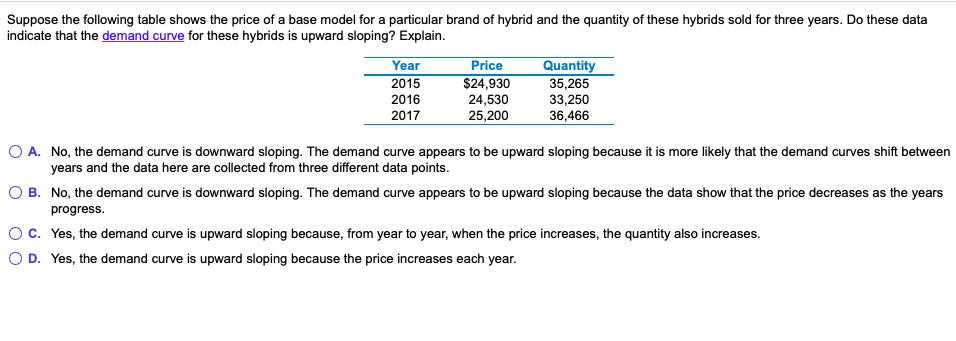
Suppose the following table shows the price of a base model for a particular brand of...
Fantastic news! We've Found the answer you've been seeking!
Question:
Transcribed Image Text:
Suppose the following table shows the price of a base model for a particular brand of hybrid and the quantity of these hybrids sold for three years. Do these data indicate that the demand curve for these hybrids is upward sloping? Explain. Year 2015 Quantity 35,265 33,250 36,466 Price $24,930 2016 2017 24,530 25,200 O A. No, the demand curve is downward sloping. The demand curve appears to be upward sloping because it is more likely that the demand curves shift between years and the data here are collected from three different data points. O B. No, the demand curve is downward sloping. The demand curve appears to be upward sloping because the data show that the price decreases as the years progress. Oc. Yes, the demand curve is upward sloping because, from year to year, when the price increases, the quantity also increases. O D. Yes, the demand curve is upward sloping because the price increases each year. Suppose the following table shows the price of a base model for a particular brand of hybrid and the quantity of these hybrids sold for three years. Do these data indicate that the demand curve for these hybrids is upward sloping? Explain. Year 2015 Quantity 35,265 33,250 36,466 Price $24,930 2016 2017 24,530 25,200 O A. No, the demand curve is downward sloping. The demand curve appears to be upward sloping because it is more likely that the demand curves shift between years and the data here are collected from three different data points. O B. No, the demand curve is downward sloping. The demand curve appears to be upward sloping because the data show that the price decreases as the years progress. Oc. Yes, the demand curve is upward sloping because, from year to year, when the price increases, the quantity also increases. O D. Yes, the demand curve is upward sloping because the price increases each year.
Expert Answer:
Answer rating: 100% (QA)
Answer Option A Here the given data is for different point of time ... View the full answer
Related Book For
Posted Date:
Students also viewed these economics questions
-
Suppose the following table shows the price of a base model Toyota Prius hybrid and the quantity of Priuses sold for three years. Do these data indicate that the demand curve for Priuses is upward...
-
Suppose the following table shows the price of a base model Toyota Prius hybrid and the quantity of Priuses sold for three years. Do these data indicate that the demand curve for Priuses is upward...
-
The following table shows the price of drinks served in The Lion Inn. How would you describe the pricechanges? Wine Ss Soft drinks Year 1 Year 1 Year 3 Year 4 91 97 102 107 95 105 112 125 78 85 35 39...
-
The city pool loses 1.0 inch of water every week due to evaporation. If the pool is 25 yards long and 12 yards wide, what is the energy required to keep the pool at 15C. If the cost of energy is...
-
Weekly rates of return (on an annualized basis) for certain securities over a given period are believed to be normally distributed with mean 8.00% and variance 0.25. Give two values x1 and x2 such...
-
Use the sign test and the signed rank lest to analyze the paired data set of adherent red blood cells given in DS 9.2.2. Do you find any evidence of a difference between the two stimulation...
-
Verify the algebra leading to Eq. (19.22) for radiation exchange between two plates facing each other. 1 21 -(Eb1 - Eb2) (19.22) 1/1 + 1/62-1
-
Consider the following two-country model of the market for spinach. All producers and consumers take the price of spinach as given. Home's supply curve for spinach is given by SH = 5 + P, where sH is...
-
Cullumber Company is considering an investment that will return a lump sum of $ 5 8 0 , 0 0 0 5 years from now. What amount should Cullumber pay for this investment in order to earn a 4 % return?
-
A cross-flow molecular filtration device equipped with a mesoporous membrane is used to separate the enzyme lysozyme from a fermentation broth, as shown in the figure (right column). Water at...
-
Carol is a salesperson paid solely by commission and is paid monthly. In September, Carol earned a total of $7,500.00 in commissions and received a mid-month advance of $2,000.00. What amount would...
-
One way of picturing the relationship between ABC and ABM is in terms of the - ABC model that shows how costs can be repurposed to provide insight into the cost and effectiveness of the processes?
-
2. A university building is air-conditioned during the day for 12 hours at a constant temperature of 22 C. It is covered by a zinc roof with 20 m length, 15 m width, with 0.2 m thickness. The thermal...
-
Critical thinking is an essential skill in public health, especially when it comes to enhancing service delivery. Given my project's focus on developing a high-yield outline of various communities...
-
1. What is trencher bread? 2. What does a 'Mille-Feuille' look like? 3. Research and provide baking temperature and cooking times for the following (you should reference your source for assessor...
-
Understanding the landscape of third-party payers in healthcare and how these organizations operate is essential for HIM professionals, who often find themselves navigating the complex intersection...
-
For the following algorithm:[Q1 multi]What is the time complexity in the worst case? ALGORITHM XYZ (A, n) // Input: An array of n elements sum = 0 for c = 1 to 1000 do if A[c] < 0 then for k=1 to n...
-
Digital Fruit is financed solely by common stock and has outstanding 25 million shares with a market price of $10 a share. It now announces that it intends to issue $160 million of debt and to use...
-
Over the past 30 years in the United States, there has been a great expansion in the number of beer brewers. Can you think of two reasons this expansion might have occurred? Use concepts from this...
-
Consider the pattern shown by the data in the following table (where the values for real GDP are in billions of 2009 dollars): Next, consider Figure 24.1 , which has real GDP on the horizontal axis,...
-
The graphs for monopoly and monopolistic competition are quite similar, but the details of each of the graphs are different. Write a paragraph explaining the differences.
-
(a) Show that the variancecovariance matrix of the disturbances in (9.1) is given by (9.2). (b) Show that the two nonzero block matrices in (9.2) can be written as in (9.3). (c) Show that...
-
Consider the following unbalanced one-way analysis of variance model \[y_{i t}=\mu_{i}+u_{i t} \quad i=1, \ldots, N \quad t=1,2, \ldots, T_{i}\] where for simplicity's sake no explanatory variables...
-
Consider the three-way error component model described in problem 3.15. The panel data can be unbalanced and the matrices of dummy variables are \(\Delta=\left[\Delta_{1}, \Delta_{2}, \Delta_{3}...
Study smarter with the SolutionInn App