

The following graph shows the aggregate demand curve. Suppose the governments of two different economies, economy J
Fantastic news! We've Found the answer you've been seeking!
Question:
The following graph shows the aggregate demand curve.
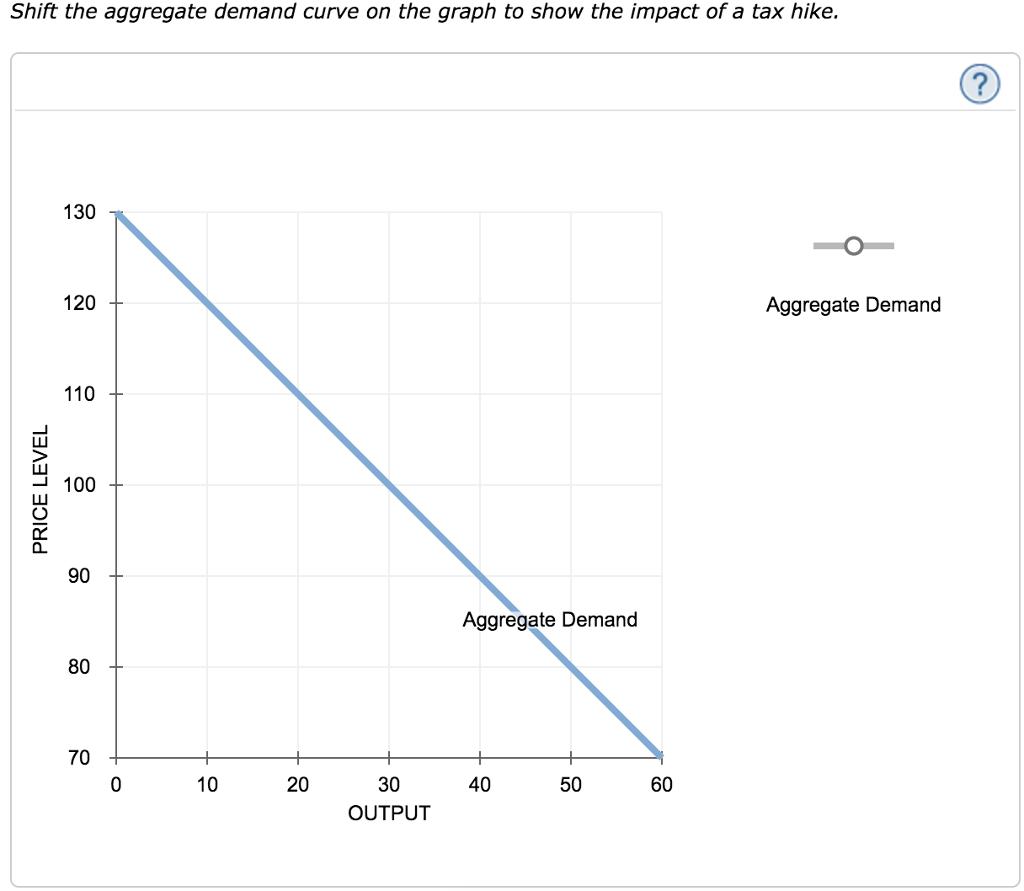
Suppose the governments of two different economies, economy J and economy K, implement a tax cut of the same size. The tax cut in economy J is permanent, while the tax cut in economy K is temporary. The economies are identical in all other respects.
The tax cut will have a larger impact on aggregate demand in the economy with the (temporary tax cut or permanent tax cut)
Expert Answer:

Related Book For 
Posted Date:
