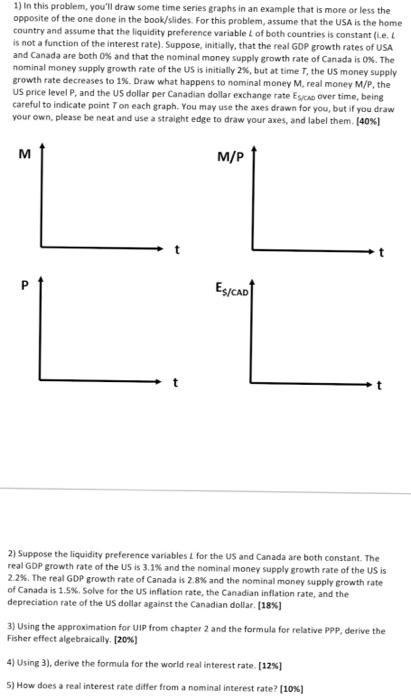
1) In this problem, you'll draw some time series graphs in an example that is more...
Fantastic news! We've Found the answer you've been seeking!
Question:
Transcribed Image Text:
1) In this problem, you'll draw some time series graphs in an example that is more or less the opposite of the one done in the book/slides. For this problem, assume that the USA is the home country and assume that the liquidity preference variable L of both countries is constant (1.e. L is not a function of the interest rate). Suppose, initially, that the real GDP growth rates of USA and Canada are both 0% and that the nominal money supply growth rate of Canada is 0%. The nominal money supply growth rate of the US is initially 25%, but at time T, the US money supply growth rate decreases to 1%. Draw what happens to nominal money M, real money M/P, the US price level P, and the US dollar per Canadian dollar exchange rate Es/CAD over time, being careful to indicate point T on each graph. You may use the axes drawn for you, but if you draw your own, please be neat and use a straight edge to draw your axes, and label them. [40% ] M/P M P ES/CAD t 2) Suppose the liquidity preference variables L for the US and Canada are both constant. The real GDP growth rate of the US is 3.1% and the nominal money supply growth rate of the US is 2.2%. The real GDP growth rate of Canada is 2.8% and the nominal money supply growth rate of Canada is 1.5%. Solve for the US inflation rate, the Canadian inflation rate, and the depreciation rate of the US dollar against the Canadian dollar. [18%) 3) Using the approximation for UIP from chapter 2 and the formula for relative PPP, derive the Fisher effect algebraically. [20% ] 4) Using 3), derive the formula for the world real interest rate. [12%] 5) How does a real interest rate differ from a nominal interest rate? [10% ] 1) In this problem, you'll draw some time series graphs in an example that is more or less the opposite of the one done in the book/slides. For this problem, assume that the USA is the home country and assume that the liquidity preference variable L of both countries is constant (1.e. L is not a function of the interest rate). Suppose, initially, that the real GDP growth rates of USA and Canada are both 0% and that the nominal money supply growth rate of Canada is 0%. The nominal money supply growth rate of the US is initially 25%, but at time T, the US money supply growth rate decreases to 1%. Draw what happens to nominal money M, real money M/P, the US price level P, and the US dollar per Canadian dollar exchange rate Es/CAD over time, being careful to indicate point T on each graph. You may use the axes drawn for you, but if you draw your own, please be neat and use a straight edge to draw your axes, and label them. [40% ] M/P M P ES/CAD t 2) Suppose the liquidity preference variables L for the US and Canada are both constant. The real GDP growth rate of the US is 3.1% and the nominal money supply growth rate of the US is 2.2%. The real GDP growth rate of Canada is 2.8% and the nominal money supply growth rate of Canada is 1.5%. Solve for the US inflation rate, the Canadian inflation rate, and the depreciation rate of the US dollar against the Canadian dollar. [18%) 3) Using the approximation for UIP from chapter 2 and the formula for relative PPP, derive the Fisher effect algebraically. [20% ] 4) Using 3), derive the formula for the world real interest rate. [12%] 5) How does a real interest rate differ from a nominal interest rate? [10% ]
Expert Answer:
Answer rating: 100% (QA)
M Initially the nominal money supply growth rate of the US is 2 so the nominal money supply M increases at a steady rate At time T the growth rate decreases to 1 so the slope of the graph becomes less ... View the full answer
Related Book For
Posted Date:
Students also viewed these accounting questions
-
Chinas real GDP growth rate has fallen from 10 percent a year to 6.8 percent a year. At the same time, the distribution of income has become more unequal. Suggestions for dealing with these problems...
-
If the money growth rate and real GDP growth rate of the 2010s are maintained and if the velocity growth rate is zero, will the inflation rate rise to 3 percent as predicted by Martin Feldstein?
-
The current risk-free rate of return, r RF , is 3 percent and the market risk premium, RPM, is 6 percent. If the beta coefficient associated with a firms stock is 1.5, what should be the stocks...
-
Bank Teller Staffing Plan As the teller supervisor at Montana Federal Credit Union you are responsible for developing a staffing plan for tellers that meets customer needs, satisfies the union...
-
Let {ak} and be real sequences. Decide which of the following statements are true and which are false. Prove the true ones and give counterexamples to the false ones. a) Suppose that 0 b) If k=1 ak...
-
In Exercises 3944, you are dealt one card from a 52-card deck. Find the probability that you are dealt a 7 or a red card.
-
An oil preheater consists of a single tube of \(10-\mathrm{mm}\) diameter and 5-m length, with its surface maintained at \(180^{\circ} \mathrm{C}\) by swirling combustion gases. The engine oil (new)...
-
A firm has a capital structure containing 60% debt and 40% common stock equity. Its outstanding bonds offer investors a 6.5% yield to maturity. The risk-free rate currently equals 5%, and the...
-
Managerial accounting is important for small businesses in several ways. The planning and decision-making support are considered a critical aspect of managerial accounting (Dearman, Lechner, &...
-
T. J. Patrick is a young, successful industrial designer in Portland, Oregon, who enjoys the excitement of commodities speculation. T. J. has been dabbling in commodities since he was a teen-ager-he...
-
The dimension of a services cape where the background characteristics of the environment that are meant to satisfy our five senses and include things such as temperature, lighting, noise, music, and...
-
How will you price your product?
-
What is your marketing communications strategy? What mix of advertising, PR, personal selling, and direct marketing is most effective?
-
How will you distribute your product?
-
Articulate what you would like your brand to be. How will you build it during launch? During growth?
-
What guerrilla tactics can you use to create a buzz? How will you get your products buzz to be heard above the noise?
-
Steps to get great ideas from your employees article. Describe a step-by-step process to acknowledge suggestions, improvements and innovations from all colleagues. For example: Every last Monday of...
-
Under what conditions is the following SQL statement valid?
-
Who in the United States loses from this trade in roses and would lobby for a restriction on the quantity of imported roses? Suppose that the U.S. government put a tariff on rose imports. Show on...
-
Label each of the entries in the list as a positive or a normative statement. Low-income people pay too much for housing. The number of U.S. farms has decreased over the past 50 years. Toyota expands...
-
Read Eye on the Environment and describe a trade off faced when deciding how to generate electricity and whether to use wind power.
-
Reconsider the regression models in Problem 12.6, parts a-e. Suppose the error terms in these models were multiplicative, not additive. Rework the problem under this new assumption regarding the...
-
Sketch the expectation function for the logistic growth model (12.34) for \(\theta_{1}=1, \theta_{3}=1\), and values of \(\theta_{2}=1,4,8\), respectively. Overlay these plots on the same \(x-y\)...
-
For the models shown below, determine whether it is a linear model, an intrinsically linear model, or a nonlinear model. If the model is intrinsically linear, show how it can be linearized by a...
Study smarter with the SolutionInn App