

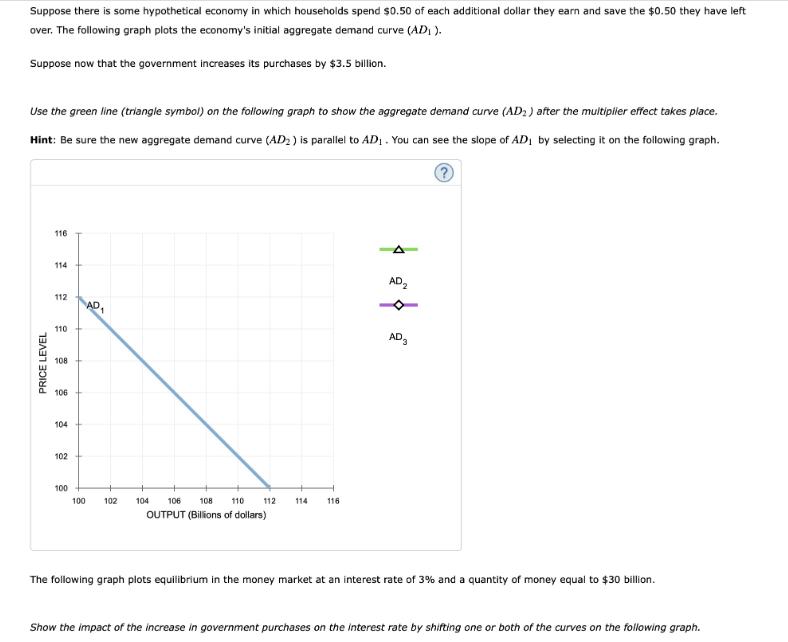
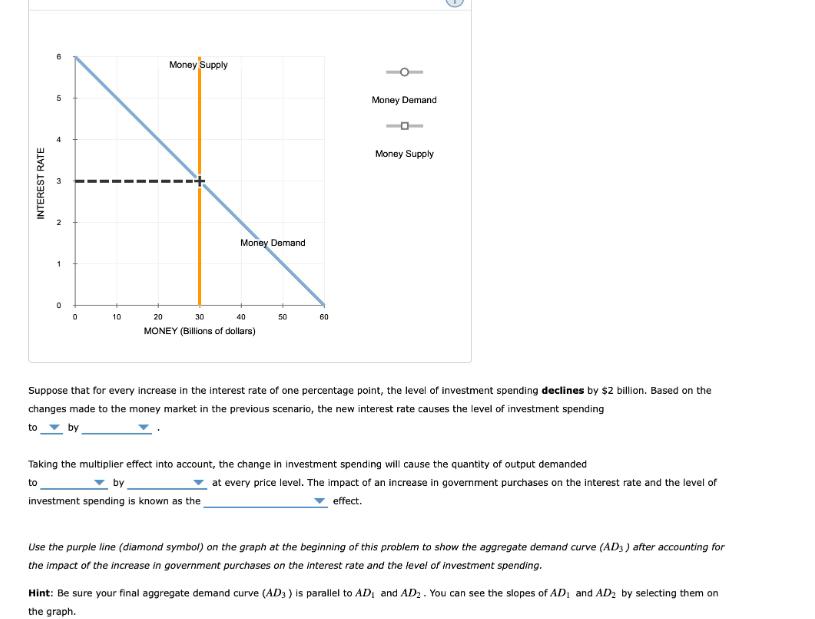
Suppose there is some hypothetical economy in which households spend $0.50 of each additional dollar they...
Fantastic news! We've Found the answer you've been seeking!
Question:
Expert Answer:
Total answers posted by the expert is 10935 Multiplier 11MPC 11052 Increase in Government purchases ... View the full answer

Related Book For 

Data Analysis and Decision Making
ISBN: 978-0538476126
4th edition
Authors: Christian Albright, Wayne Winston, Christopher Zappe
Posted Date:
