

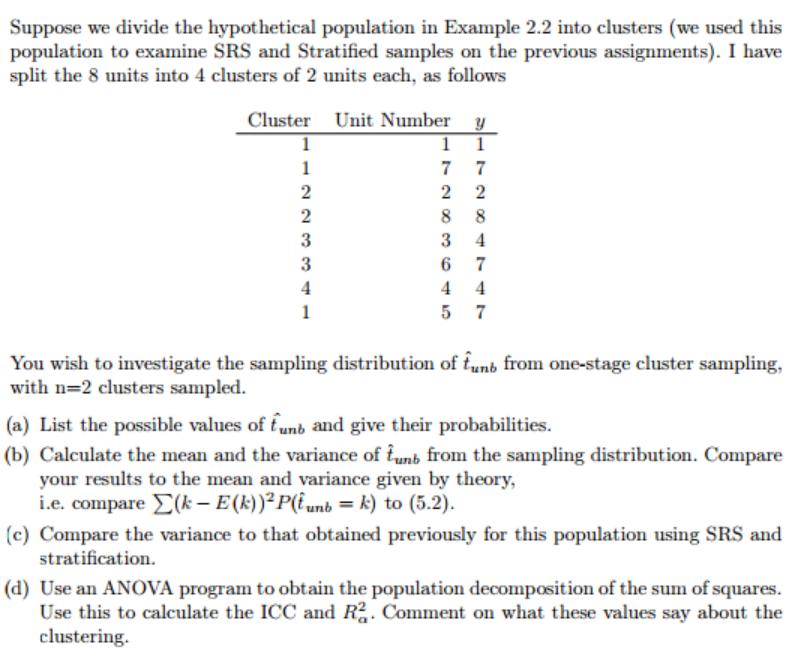
Suppose we divide the hypothetical population in Example 2.2 into clusters (we used this population to...
Fantastic news! We've Found the answer you've been seeking!
Question:
Transcribed Image Text:
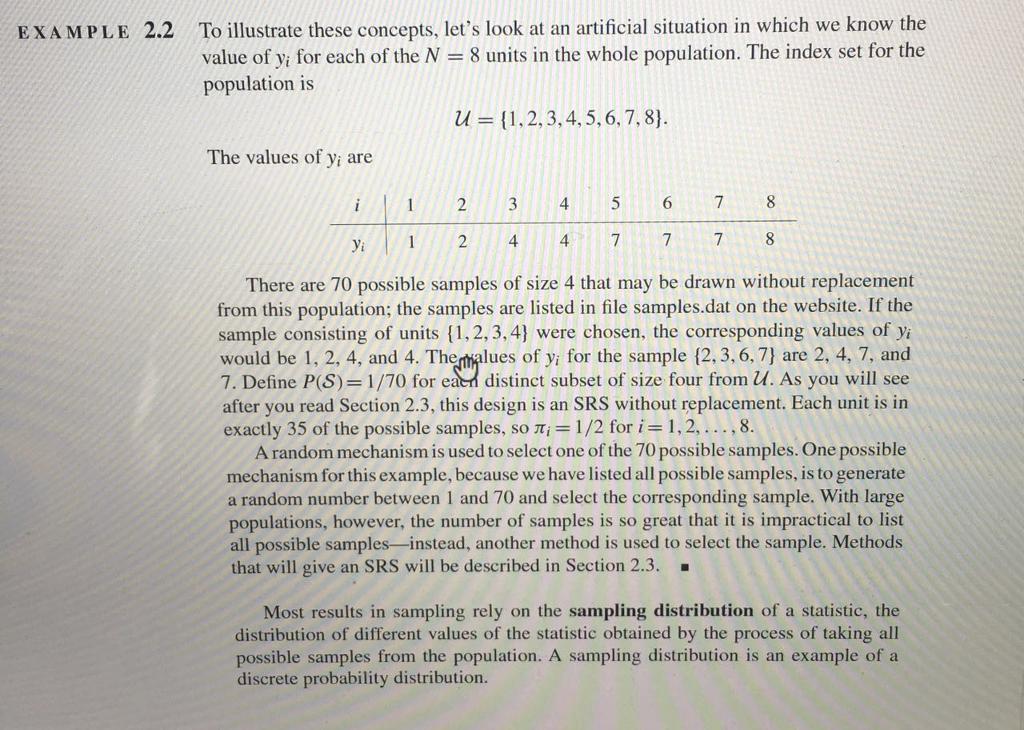
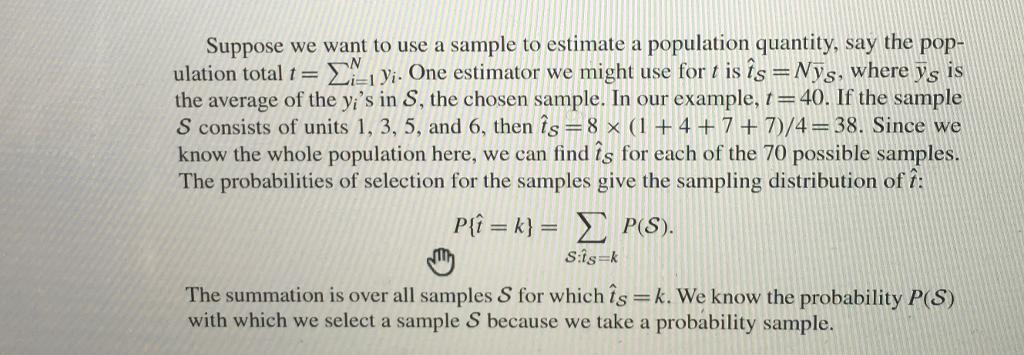
Suppose we divide the hypothetical population in Example 2.2 into clusters (we used this population to examine SRS and Stratified samples on the previous assignments). I have split the 8 units into 4 clusters of 2 units each, as follows Cluster Unit Number y 1 1 1 1 2 2 3 3 1 77 22 88 3 4 6 7 4 4 57 You wish to investigate the sampling distribution of funt from one-stage cluster sampling, with n=2 clusters sampled. (a) List the possible values of fun and give their probabilities. (b) Calculate the mean and the variance of funt from the sampling distribution. Compare your results to the mean and variance given by theory, i.e. compare (k-E(k))2 P(unb = k) to (5.2). (c) Compare the variance to that obtained previously for this population using SRS and stratification. (d) Use an ANOVA program to obtain the population decomposition of the sum of squares. Use this to calculate the ICC and R₂. Comment on what these values say about the clustering. EXAMPLE 2.2 To illustrate these concepts, let's look at an artificial situation in which we know the value of y; for each of the N = 8 units in the whole population. The index set for the population is The values of y; are i 1 Yi 1 U= {1, 2, 3, 4, 5, 6, 7, 8). 2 3 4 4 4 5 7 6 7 7 8 7 There are 70 possible samples of size 4 that may be drawn without replacement from this population; the samples are listed in file samples.dat on the website. If the sample consisting of units {1,2,3,4} were chosen, the corresponding values of yi would be 1, 2, 4, and 4. The malues of y; for the sample (2,3,6,7} are 2, 4, 7, and 7. Define P(S)=1/70 for each distinct subset of size four from U. As you will see after you read Section 2.3, this design is an SRS without replacement. Each unit is in exactly 35 of the possible samples, so л₁ = 1/2 for i=1,2,...,8. A random mechanism is used to select one of the 70 possible samples. One possible mechanism for this example, because we have listed all possible samples, is to generate a random number between 1 and 70 and select the corresponding sample. With large populations, however, the number of samples is so great that it is impractical to list all possible samples instead, another method is used to select the sample. Methods that will give an SRS will be described in Section 2.3. ■ 8 Most results in sampling rely on the sampling distribution of a statistic, the distribution of different values of the statistic obtained by the process of taking all possible samples from the population. A sampling distribution is an example of a discrete probability distribution. Suppose we want to use a sample to estimate a population quantity, say the pop- ulation total t = y₁. One estimator we might use for t is îs = Nys, where ys is the average of the y's in S, the chosen sample. In our example, t = 40. If the sample S consists of units 1, 3, 5, and 6, then îs = 8 x (1 +4+7+7)/4= 38. Since we know the whole population here, we can find îs for each of the 70 possible samples. The probabilities of selection for the samples give the sampling distribution of 1: P{î=k} = Σ P(s). S:1s=k The summation is over all samples S for which is =k. We know the probability P(S) with which we select a sample S because we take a probability sample. Suppose we divide the hypothetical population in Example 2.2 into clusters (we used this population to examine SRS and Stratified samples on the previous assignments). I have split the 8 units into 4 clusters of 2 units each, as follows Cluster Unit Number y 1 1 1 1 2 2 3 3 1 77 22 88 3 4 6 7 4 4 57 You wish to investigate the sampling distribution of funt from one-stage cluster sampling, with n=2 clusters sampled. (a) List the possible values of fun and give their probabilities. (b) Calculate the mean and the variance of funt from the sampling distribution. Compare your results to the mean and variance given by theory, i.e. compare (k-E(k))2 P(unb = k) to (5.2). (c) Compare the variance to that obtained previously for this population using SRS and stratification. (d) Use an ANOVA program to obtain the population decomposition of the sum of squares. Use this to calculate the ICC and R₂. Comment on what these values say about the clustering. EXAMPLE 2.2 To illustrate these concepts, let's look at an artificial situation in which we know the value of y; for each of the N = 8 units in the whole population. The index set for the population is The values of y; are i 1 Yi 1 U= {1, 2, 3, 4, 5, 6, 7, 8). 2 3 4 4 4 5 7 6 7 7 8 7 There are 70 possible samples of size 4 that may be drawn without replacement from this population; the samples are listed in file samples.dat on the website. If the sample consisting of units {1,2,3,4} were chosen, the corresponding values of yi would be 1, 2, 4, and 4. The malues of y; for the sample (2,3,6,7} are 2, 4, 7, and 7. Define P(S)=1/70 for each distinct subset of size four from U. As you will see after you read Section 2.3, this design is an SRS without replacement. Each unit is in exactly 35 of the possible samples, so л₁ = 1/2 for i=1,2,...,8. A random mechanism is used to select one of the 70 possible samples. One possible mechanism for this example, because we have listed all possible samples, is to generate a random number between 1 and 70 and select the corresponding sample. With large populations, however, the number of samples is so great that it is impractical to list all possible samples instead, another method is used to select the sample. Methods that will give an SRS will be described in Section 2.3. ■ 8 Most results in sampling rely on the sampling distribution of a statistic, the distribution of different values of the statistic obtained by the process of taking all possible samples from the population. A sampling distribution is an example of a discrete probability distribution. Suppose we want to use a sample to estimate a population quantity, say the pop- ulation total t = y₁. One estimator we might use for t is îs = Nys, where ys is the average of the y's in S, the chosen sample. In our example, t = 40. If the sample S consists of units 1, 3, 5, and 6, then îs = 8 x (1 +4+7+7)/4= 38. Since we know the whole population here, we can find îs for each of the 70 possible samples. The probabilities of selection for the samples give the sampling distribution of 1: P{î=k} = Σ P(s). S:1s=k The summation is over all samples S for which is =k. We know the probability P(S) with which we select a sample S because we take a probability sample.
Expert Answer:
Answer rating: 100% (QA)
a 10 times H H H T H T T H H T The number of heads in the ... View the full answer

Related Book For 

Posted Date:
Students also viewed these accounting questions
-
Give an example of a specific sampling distribution we studied in this section. Outline other possible examples of sampling distributions from areas such as business administration, economics,...
-
Suppose in a two-stage cluster sample that all population cluster sizes are equal (Mi = M for all i), and that all sample sizes for the clusters are equal (mi = m for all i). a. Show (5.30). b. Show...
-
Suppose in a two-stage cluster sample that all population cluster sizes are equal (Mi = M for all i), and that all sample sizes for the clusters are equal (mi = m for all i). a. Show that unb = r ,...
-
The par yield curve for U.S. Treasury bonds is currently flat across all maturities at 5.50 percent. You have observed following "paired" transaction by your bond portfolio manager: Bond G H...
-
1. Which aspects of HRM discussed in this chapter are illustrated in these videos? Explain your answer. 2. How is ethics illustrated in these videos? Explain your answer. 3. As a manager, how else...
-
Enumerate and explain various allowances provided for pattern making.
-
To compute the test statistic for a test with matched pairs, we must compute the standard deviations of the samples. In Exercises 5 and 6, determine whether the statement is true or false. If the...
-
For the customers in Exercise, In exercise At a major credit card bank, the percentages of people who historically apply for the Silver, Gold, and Platinum cards are 60%, 30%, and 10%, respectively....
-
Workshop 7 (week 8): The cost of hedging against the 'unknowns' In this workshop we want you to work out the cost of hedging the tail risk (the 'unknowns') of a trading portfolio. Note that banks can...
-
In a sample of 539 households from a certain Midwestern city, it was found that 133 of these households owned at least one firearm. Give a 99% confidence interval for the percentage of families in...
-
Breamlea Ltd has a dividend reinvestment plan in which it provides participating shareholders with dividends amounting to $1 800 000. The shares are existing shares, which will be acquired from the...
-
Would a high tax on oil significantly reduce the amount of pollution coming from the use of oil? Why or why not?
-
How would an economist likely respond to the statement There is no such thing as an acceptable level of pollution?
-
Is the marginal social benefit of a good that exhibits positive externalities greater or less than the private social benefit of that good? Why?
-
Change the recurring costs in Problem and Exercise 11 to $40,000 and redo the analysis. Problem and Exercise 11 Assume monetary benefits of an information system of $40,000 the first year and...
-
List the public-good aspects (if any) of the following goods: safety, street names, and a steak dinner.
-
There are two primary reasons that guide my approach to back up files externally. First, there's the aspect of cost savings. Investing in a hard drive with sufficient storage capacity constitutes a...
-
Write an essay describing the differing approaches of nursing leaders and managers to issues in practice. To complete this assignment, do the following: 1. Select an issue from the following list:...
-
Explain why stepwise regression is used. What is its value in the model-building process?
-
Identify the problem(s) in each of the residual plots shown on page 707. a. b. c. d. 3s 0 0 Relative frequency
-
Consider the MINITAB histogram shown below. a. Is this a frequency histogram or a relative frequency histogram? Explain. b. How many class intervals were used in the construction of this histogram?...
-
Match List I with List II an select the correct answer using the codes given below the lists: List I A. Quadric cycle chain B. Single slider crank chain C. Double slider crank chain D. Crossed slider...
-
In gears, interference takes place when (a) the tip of a tooth of mating gear digs into the portion between base and root circle (b) gear do not move smoothly in the absence of lubrication (c) pitch...
-
In a flat collar pivot bearing, the moment due to friction is proportional to \(\left(r_{1} ight.\) and \(r_{2}\) are the outer and inner radii respectively) (a)...

Study smarter with the SolutionInn App