

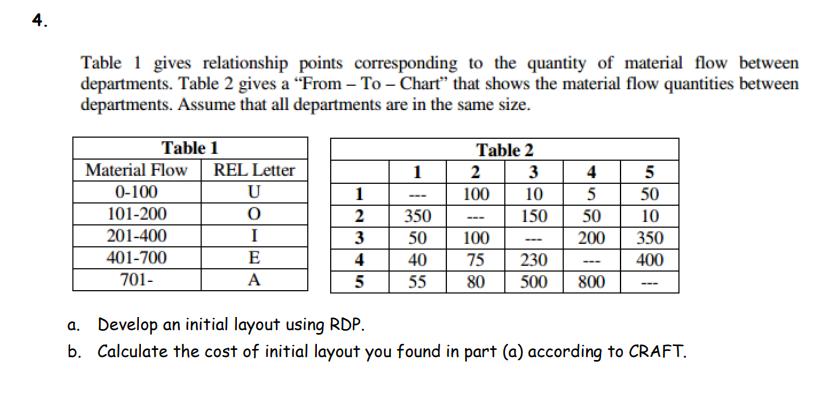
Table 1 gives relationship points corresponding to the quantity of material flow betweendepartments. Table 2 gives a
Fantastic news! We've Found the answer you've been seeking!
Question:
Table gives relationship points corresponding to the quantity of material flow betweendepartments. Table gives a "From To Chart" that shows the material flow quantities betweendepartments. Assume that all departments are in the same size.a Develop an initial layout using RDPb Calculate the cost of initial layout you found in part a according to CRAFT.
Expert Answer:

Related Book For 

Macroeconomics Principles And Policy
ISBN: 9780324586213
11th Edition
Authors: William J. Baumol, Alan S. Blinder
Posted Date:
