

Table 2.10 shows the resistivity and TCR ( ? ) of Cu?Ni alloys. Plot TCR versus 1/
Fantastic news! We've Found the answer you've been seeking!
Question:
Table 2.10 shows the resistivity and TCR ( ? ) of Cu?Ni alloys. Plot TCR versus 1/ ? , and obtain the best-fit line. What is your conclusion? Consider the Matthiessen rule, and explain why the plot should be a straight line. What is the relationship between ? Cu, ? Cu, ? CuNi, and ? CuNi? Can this be generalized?
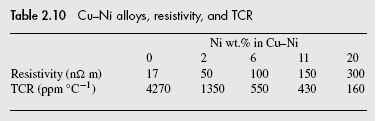
NOTE: ppm-parts per million, i.e., 10????-6.
Expert Answer:
The plot of temperature coefficient of resistivity TCR versus 1 is as follows Fi... View the full answer

Related Book For 

Posted Date:
