

Table 2.4 in Berk and DeMarzo (2020) provide key financial ratios for large US firms updated in
Fantastic news! We've Found the answer you've been seeking!
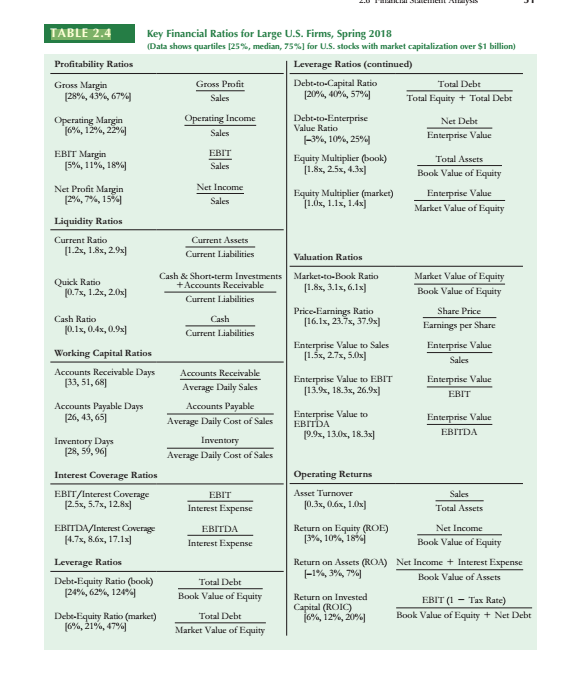
Question:
Table 2.4 in Berk and DeMarzo (2020) provide key financial ratios for large US firms updated in Spring of 2018. Within this table, the authors highlight the 25%, median, and 75% quartiles for each type of ratio. Using examples of firms, explain why there are significant differences between the 25% and 75% quartiles for large companies specifically focusing on the Net Profit Margin, Asset Turnover, and the Equity Multiplier. How would you explain the differences between firms in the lower and upper quartiles (hint: see the DuPont identity for guidance)? Include at least two citations that support your response.
Expert Answer:
There are several reasons why there are significant differences between the 25 and 75 quartiles for ... View the full answer

Related Book For 

Concepts of Database Management
ISBN: 978-1285427102
8th edition
Authors: Philip J. Pratt, Mary Z. Last
Posted Date:
