

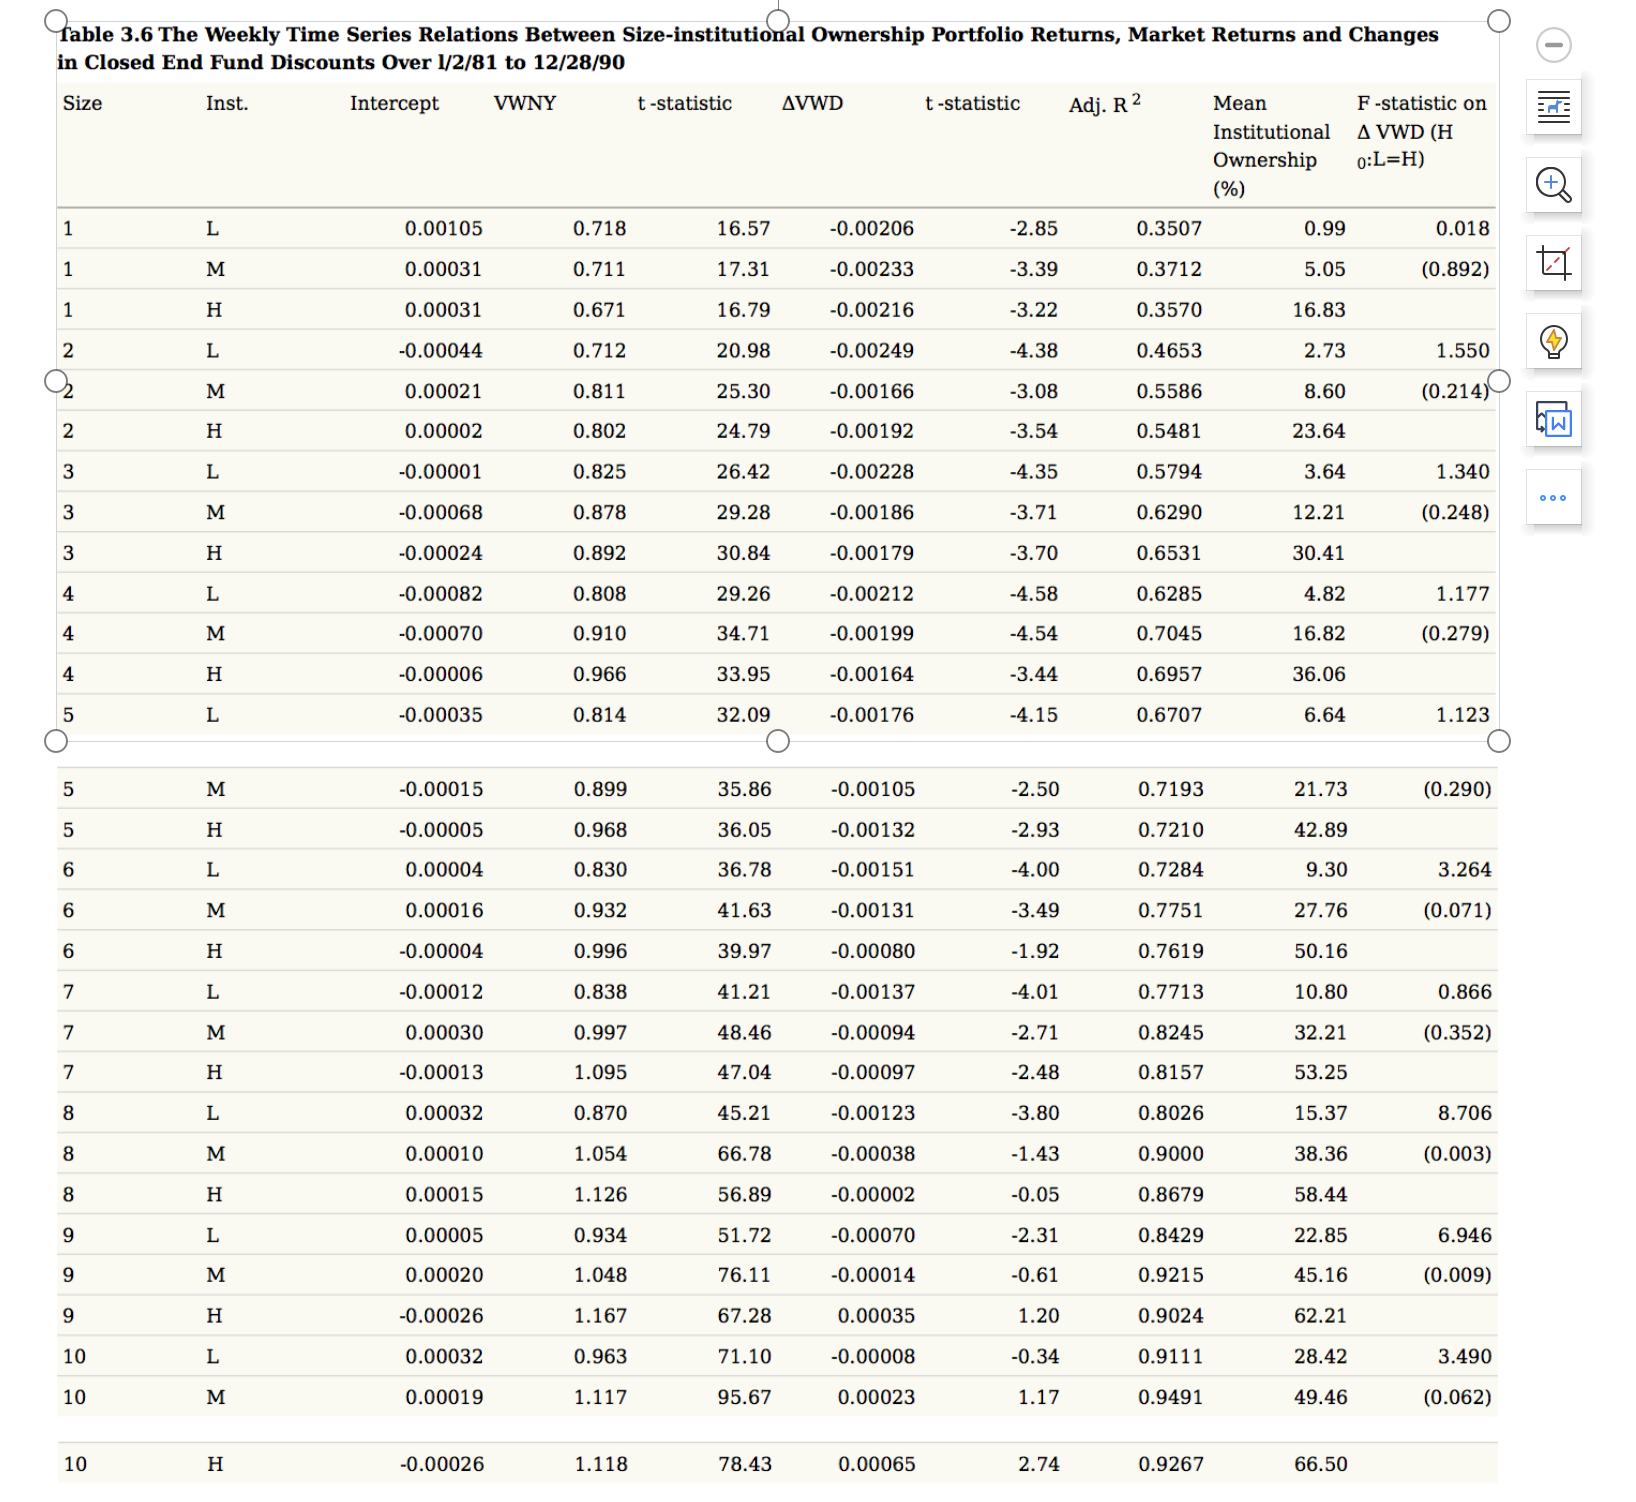
Table 3.6 The Weekly Time Series Relations Between Size-institutional Ownership Portfolio Returns, Market Returns and Changes...
Fantastic news! We've Found the answer you've been seeking!
Question:
Expert Answer:
This table presents regression results exploring the relationship between portfolio returns and institutional ownership while also considering market returns and changes in closedend fund discounts ov... View the full answer

Related Book For 

Quantitative Investment Analysis
ISBN: 978-1119104223
3rd edition
Authors: Richard A. DeFusco, Dennis W. McLeavey, Jerald E. Pinto, David E. Runkle
Posted Date:
