

Task 3: Percentage calculation Write a function named get_percentage (table, column, category), which returns the percentage...
Fantastic news! We've Found the answer you've been seeking!
Question:
Transcribed Image Text:
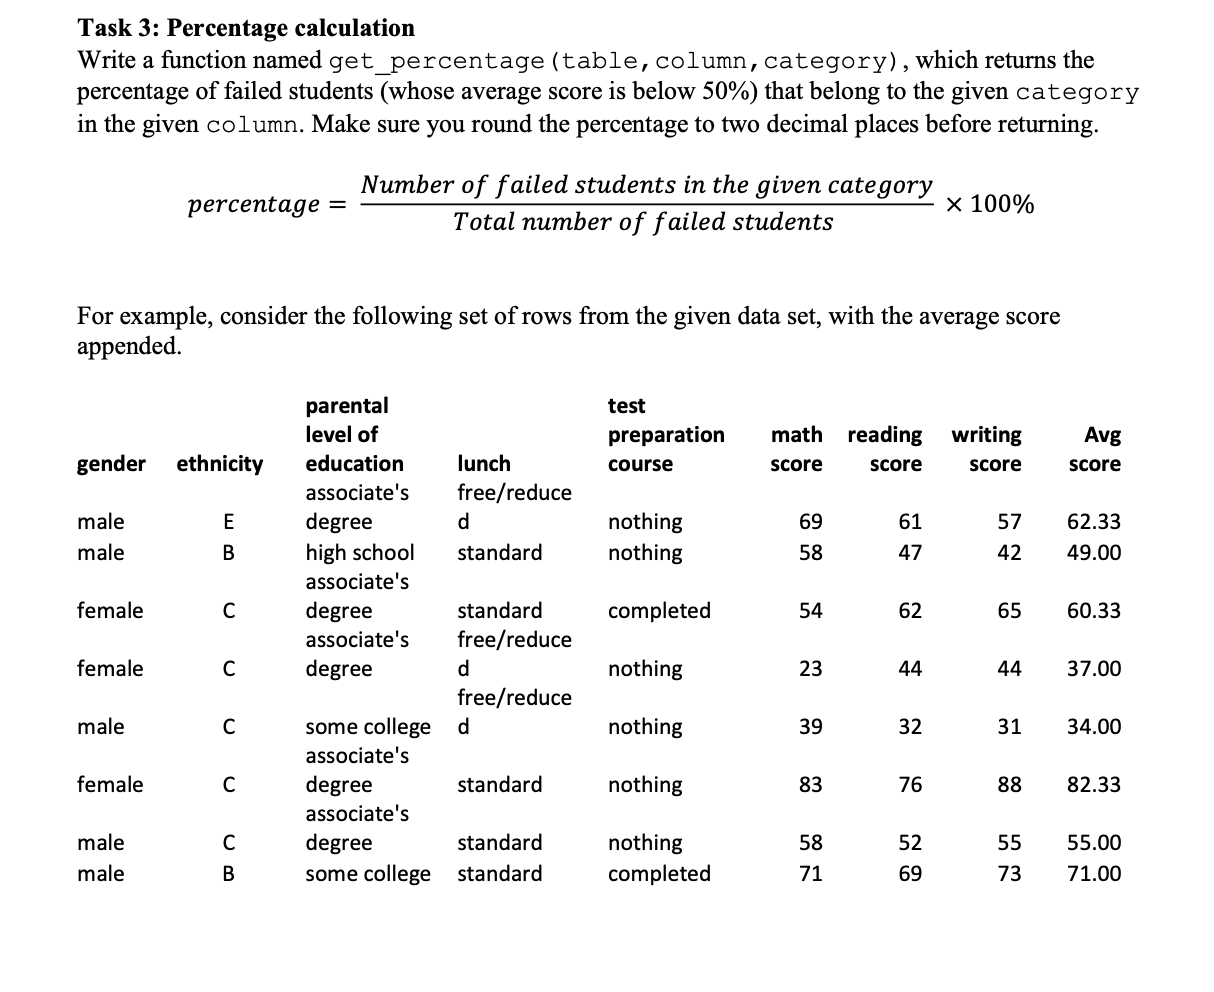
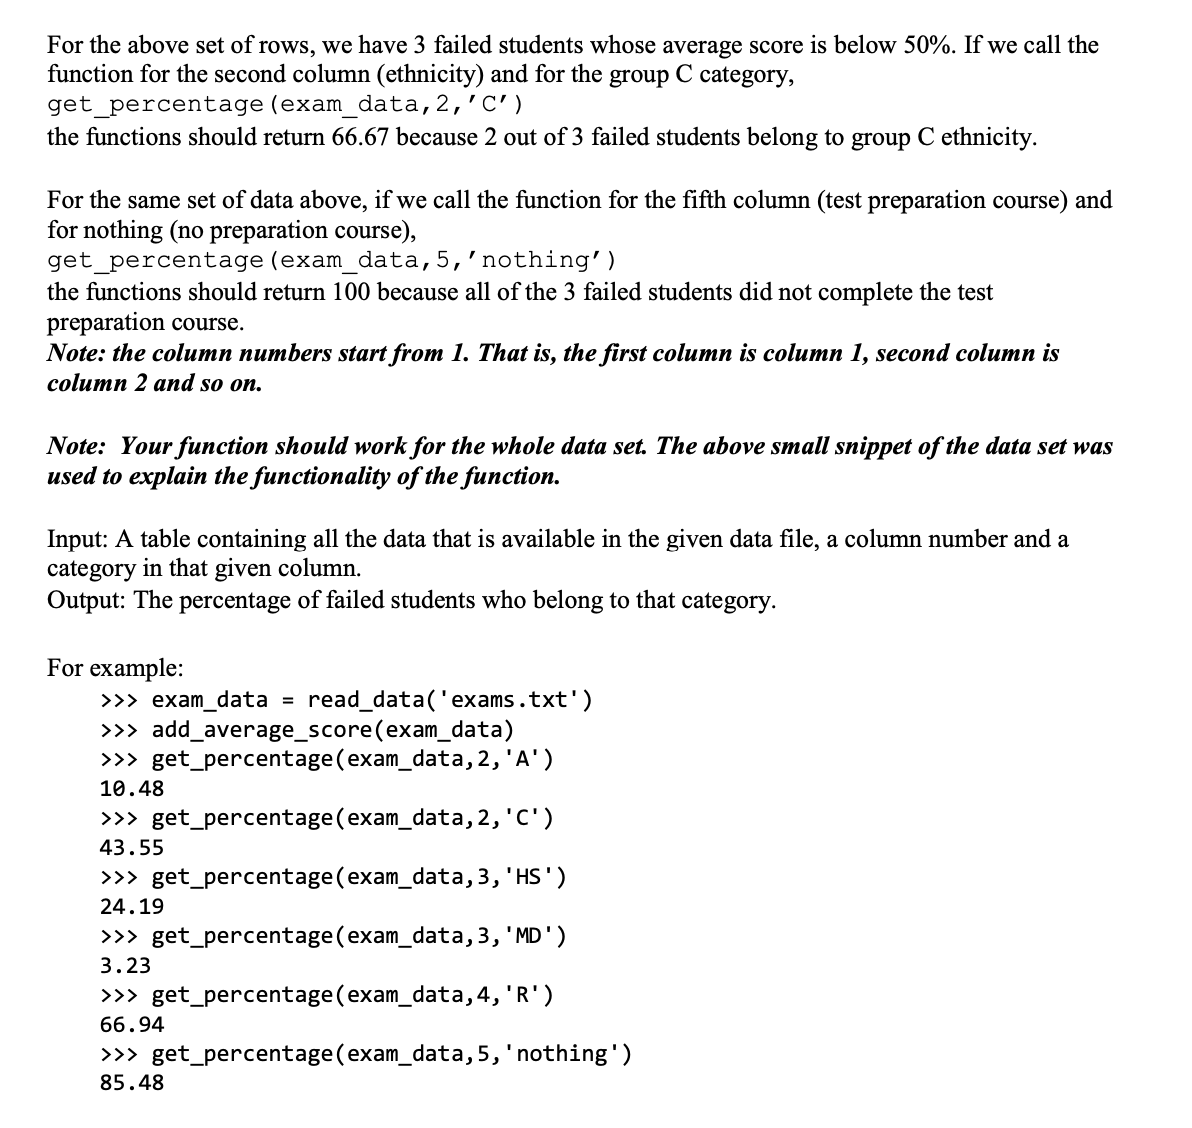
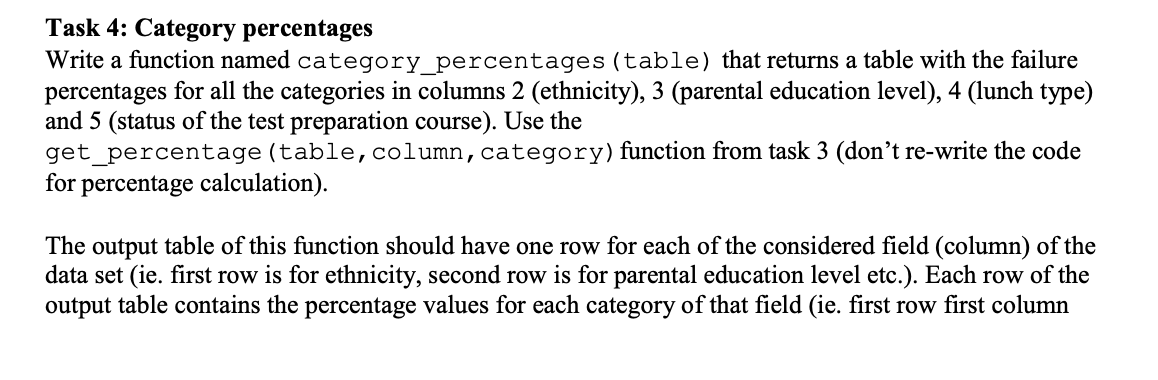
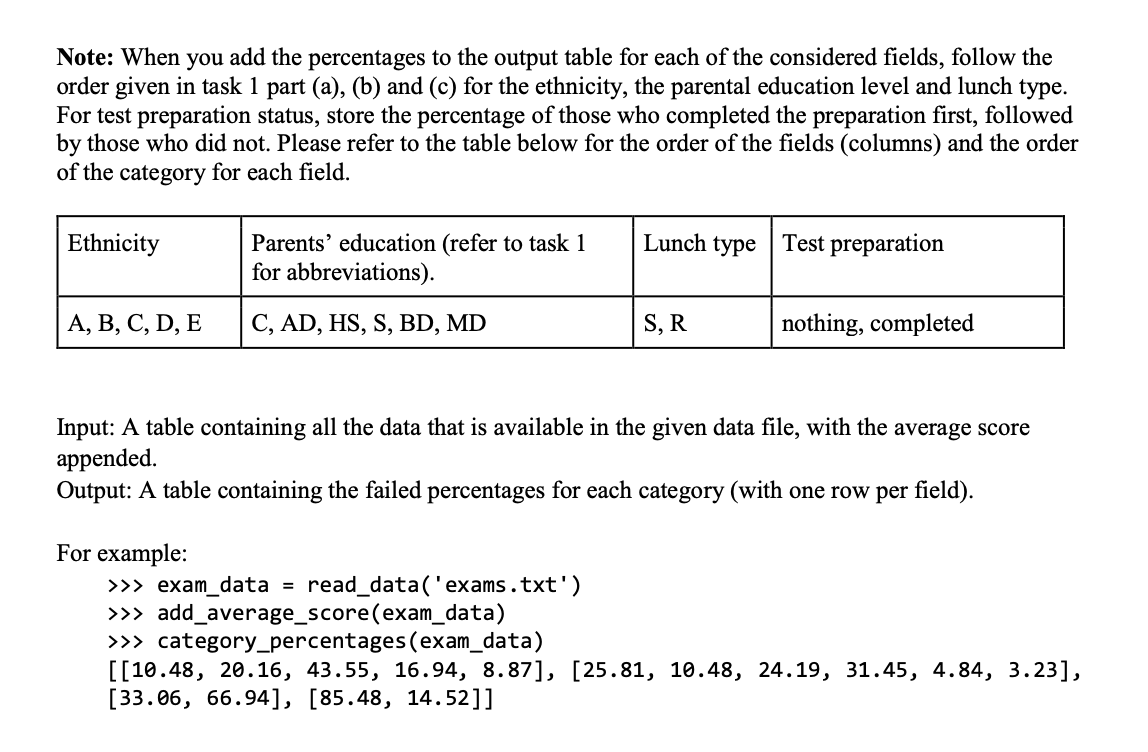
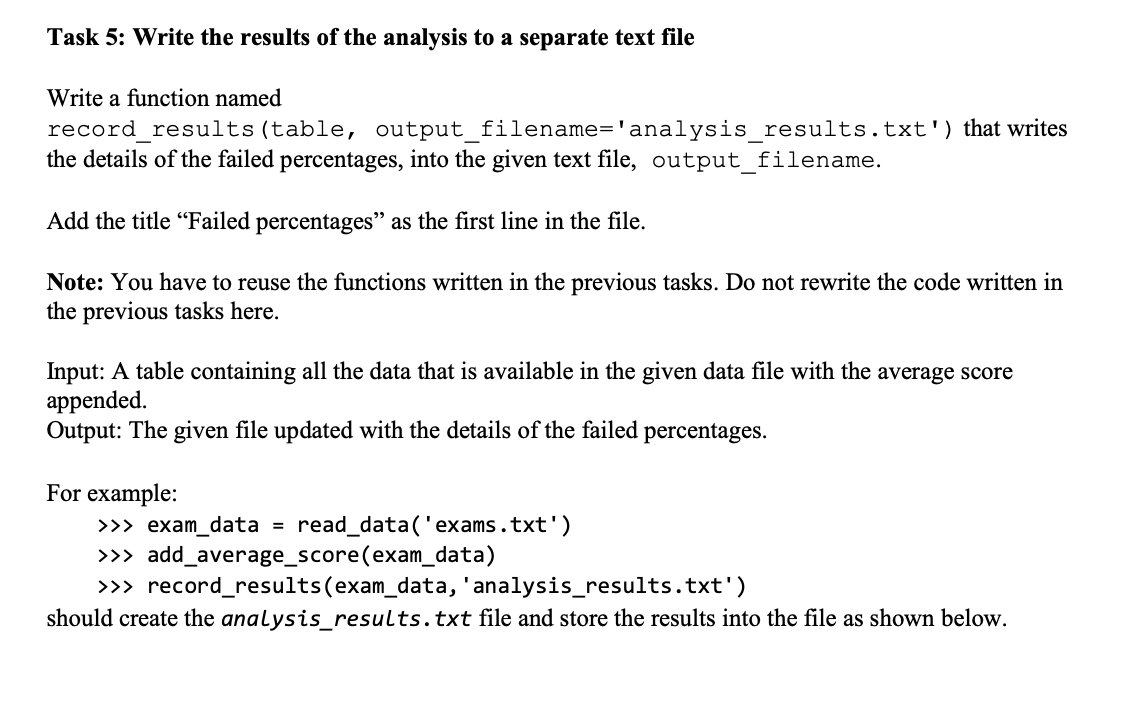
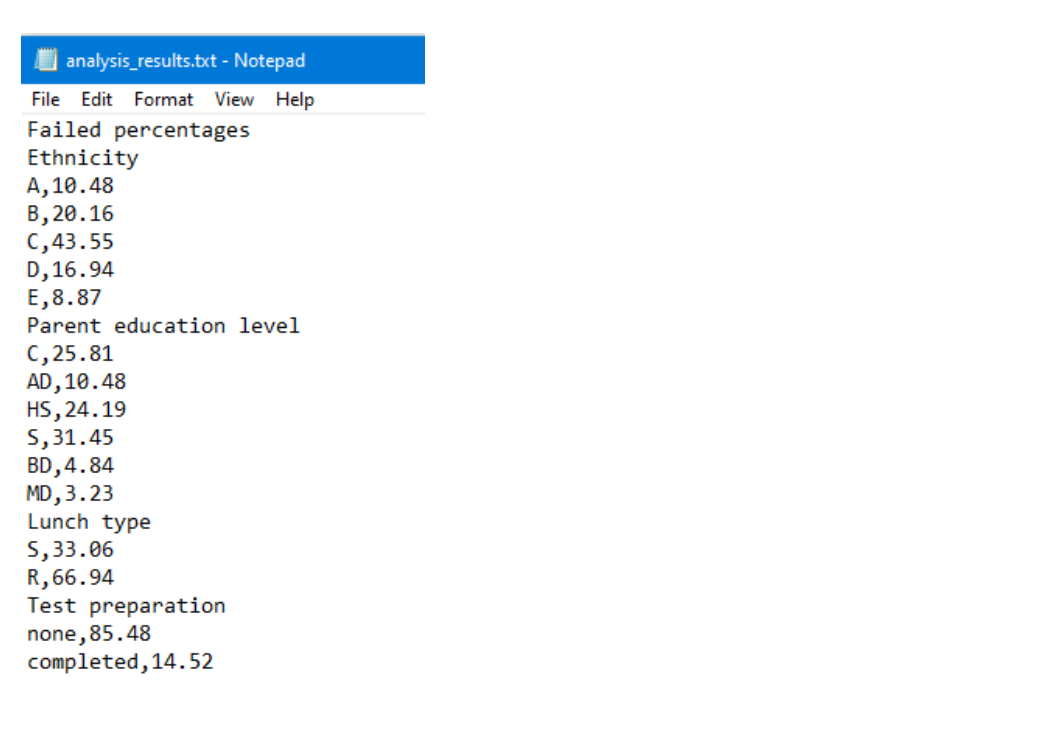
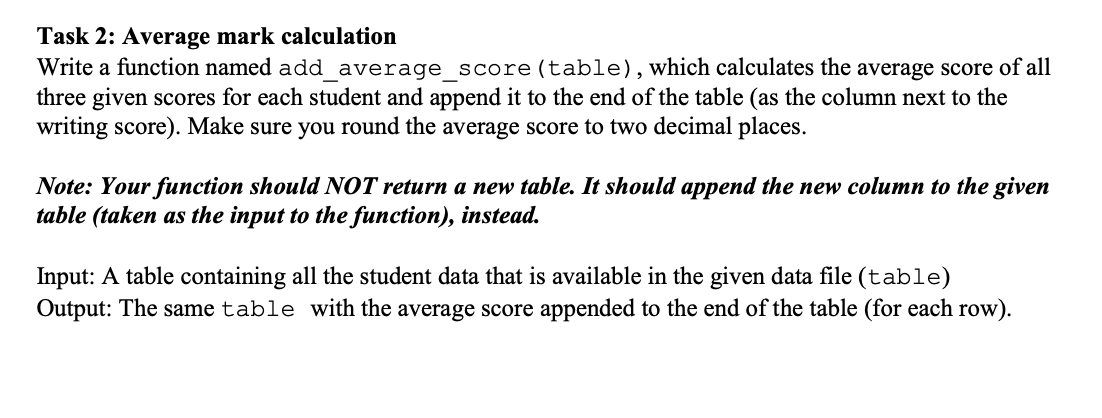
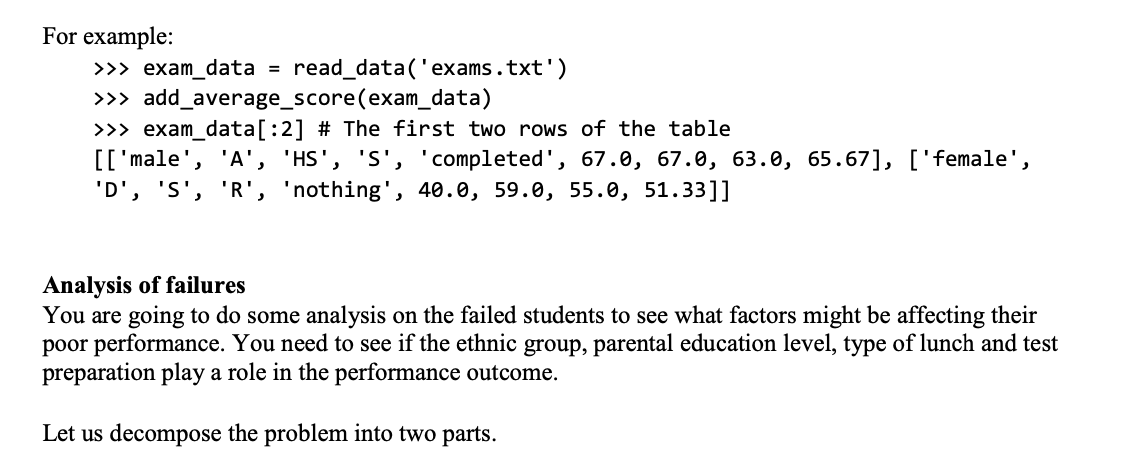
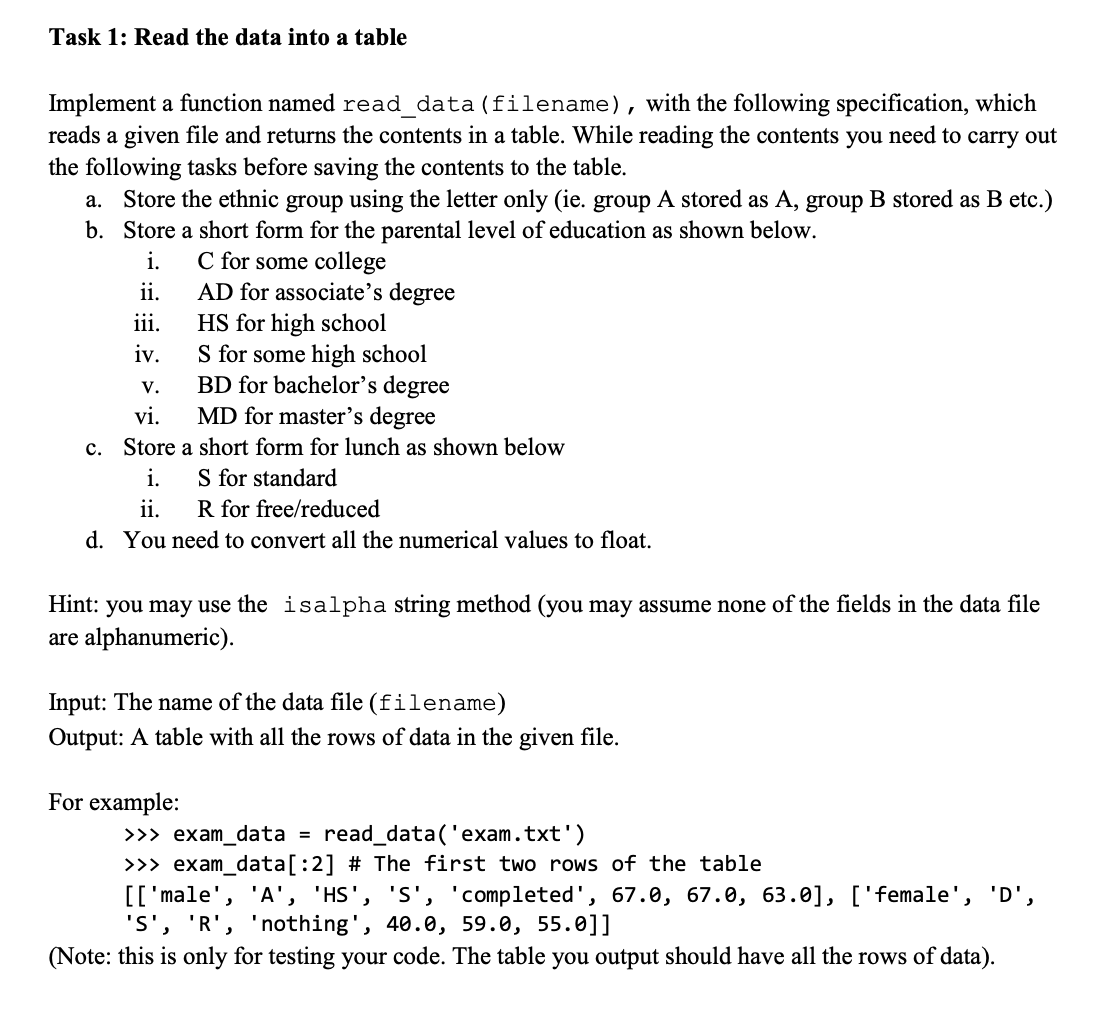
Task 3: Percentage calculation Write a function named get_percentage (table, column, category), which returns the percentage of failed students (whose average score is below 50%) that belong to the given category in the given column. Make sure you round the percentage to two decimal places before returning. gender male male For example, consider the following set of rows from the given data set, with the average score appended. female female male female percentage = male male ethnicity EB C C C C Number of failed students in the given category Total number of failed students B parental level of education associate's degree high school associate's degree associate's degree some college associate's degree associate's degree some college lunch free/reduce d standard standard free/reduce d free/reduce d standard standard standard test preparation course nothing nothing completed nothing nothing nothing nothing completed math reading writing score score score 69 58 54 23 39 83 58 71 61 47 62 44 32 x 100% 76 52 69 57 42 65 31 88 Avg score 44 37.00 55 73 62.33 49.00 60.33 34.00 82.33 55.00 71.00 For the above set of rows, we have 3 failed students whose average score is below 50%. If we call the function for the second column (ethnicity) and for the group C category, get_percentage (exam_data, 2, 'C') the functions should return 66.67 because 2 out of 3 failed students belong to group C ethnicity. For the same set of data above, if we call the function for the fifth column (test preparation course) and for nothing (no preparation course), get_percentage (exam_data, 5, 'nothing') the functions should return 100 because all of the 3 failed students did not complete the test preparation course. Note: the column numbers start from 1. That is, the first column is column 1, second column is column 2 and so on. Note: Your function should work for the whole data set. The above small snippet of the data set was used to explain the functionality of the function. Input: A table containing all the data that is available in the given data file, a column number and a category in that given column. Output: The percentage of failed students who belong to that category. For example: >>> exam_data = read_data('exams.txt') >>> add_average_score (exam_data) >>> get_percentage (exam_data, 2, 'A') 10.48 >>> get_percentage (exam_data, 2, 'C') 43.55 >>>get_percentage (exam_data, 3, 'HS') 24.19 >>> get_percentage (exam_data, 3, 'MD') 3.23 >>> get_percentage (exam_data, 4, 'R') 66.94 >>> get_percentage (exam_data, 5, 'nothing') 85.48 Task 4: Category percentages Write a function named category_percentages (table) that returns a table with the failure percentages for all the categories in columns 2 (ethnicity), 3 (parental education level), 4 (lunch type) and 5 (status of the test preparation course). Use the get_percentage (table, column, category) function from task 3 (don't re-write the code for percentage calculation). The output table of this function should have one row for each of the considered field (column) of the data set (ie. first row is for ethnicity, second row is for parental education level etc.). Each row of the output table contains the percentage values for each category of that field (ie. first row first column Note: When you add the percentages to the output table for each of the considered fields, follow the order given in task 1 part (a), (b) and (c) for the ethnicity, the parental education level and lunch type. For test preparation status, store the percentage of those who completed the preparation first, followed by those who did not. Please refer to the table below for the order of the fields (columns) and the order of the category for each field. Ethnicity A, B, C, D, E Parents' education (refer to task 1 for abbreviations). C, AD, HS, S, BD, MD For example: Lunch type Test preparation >>> exam_data = read_data('exams.txt') >>> add_average_score(exam_data) >>> category_percentages (exam_data) S, R Input: A table containing all the data that is available in the given data file, with the average score appended. Output: A table containing the failed percentages for each category (with one row per field). nothing, completed [[10.48, 20.16, 43.55, 16.94, 8.87], [25.81, 10.48, 24.19, 31.45, 4.84, 3.23], [33.06, 66.94], [85.48, 14.52]] Task 5: Write the results of the analysis to a separate text file Write a function named record_results (table, output_filename='analysis_results.txt') that writes the details of the failed percentages, into the given text file, output_filename. Add the title "Failed percentages" as the first line in the file. Note: You have to reuse the functions written in the previous tasks. Do not rewrite the code written in the previous tasks here. Input: A table containing all the data that is available in the given data file with the average score appended. Output: The given file updated with the details of the failed percentages. For example: >>> exam_data = read_data('exams.txt') >>> add_average_score(exam_data) >>> record_results(exam_data, 'analysis_results.txt') should create the analysis_results.txt file and store the results into the file as shown below. analysis_results.txt - Notepad File Edit Format View Help Failed percentages Ethnicity A, 10.48 B, 20.16 C,43.55 D, 16.94 E,8.87 Parent education level C, 25.81 AD, 10.48 HS, 24.19 S,31.45 BD,4.84 MD, 3.23 Lunch type 5,33.06 R, 66.94 Test preparation none, 85.48 completed, 14.52 Task 2: Average mark calculation Write a function named add_average_score (table), which calculates the average score of all three given scores for each student and append it to the end of the table (as the column next to the writing score). Make sure you round the average score to two decimal places. Note: Your function should NOT return a new table. It should append the new column to the given table (taken as the input to the function), instead. Input: A table containing all the student data that is available in the given data file (table) Output: The same table with the average score appended to the end of the table (for each row). For example: >>> exam_data read_data('exams.txt') >>> add_average_score (exam_data) >>> exam_data[:2] # The first two rows of the table [['male', 'A', 'HS', 'S', 'completed', 67.0, 67.0, 63.0, 65.67], ['female', 'D', 'S', 'R', 'nothing', 40.0, 59.0, 55.0, 51.33]] Analysis of failures You are going to do some analysis on the failed students to see what factors might be affecting their poor performance. You need to see if the ethnic group, parental education level, type of lunch and test preparation play a role in the performance outcome. Let us decompose the problem into two parts. Task 1: Read the data into a table Implement a function named read_data (filename), with the following specification, which reads a given file and returns the contents in a table. While reading the contents you need to carry out the following tasks before saving the contents to the table. a. Store the ethnic group using the letter only (ie. group A stored as A, group B stored as B etc.) Store a short form for the parental level of education as shown below. b. i. C for some college ii. AD for associate's degree iii. iv. HS for high school S for some high school V. BD for bachelor's degree vi. MD for master's degree c. Store a short form for lunch as shown below i. S for standard ii. R for free/reduced d. You need to convert all the numerical values to float. Hint: you may use the isalpha string method (you may assume none of the fields in the data file are alphanumeric). Input: The name of the data file (filename) Output: A table with all the rows of data in the given file. For example: >>> exam_data = read_data('exam.txt') >>> exam_data[:2] # The first two rows of the table [['male', 'A', 'HS', 'S', 'completed', 67.0, 67.0, 63.0], ['female', 'D', 'S', 'R', 'nothing', 40.0, 59.0, 55.0]] (Note: this is only for testing your code. The table you output should have all the rows of data). Task 3: Percentage calculation Write a function named get_percentage (table, column, category), which returns the percentage of failed students (whose average score is below 50%) that belong to the given category in the given column. Make sure you round the percentage to two decimal places before returning. gender male male For example, consider the following set of rows from the given data set, with the average score appended. female female male female percentage = male male ethnicity EB C C C C Number of failed students in the given category Total number of failed students B parental level of education associate's degree high school associate's degree associate's degree some college associate's degree associate's degree some college lunch free/reduce d standard standard free/reduce d free/reduce d standard standard standard test preparation course nothing nothing completed nothing nothing nothing nothing completed math reading writing score score score 69 58 54 23 39 83 58 71 61 47 62 44 32 x 100% 76 52 69 57 42 65 31 88 Avg score 44 37.00 55 73 62.33 49.00 60.33 34.00 82.33 55.00 71.00 For the above set of rows, we have 3 failed students whose average score is below 50%. If we call the function for the second column (ethnicity) and for the group C category, get_percentage (exam_data, 2, 'C') the functions should return 66.67 because 2 out of 3 failed students belong to group C ethnicity. For the same set of data above, if we call the function for the fifth column (test preparation course) and for nothing (no preparation course), get_percentage (exam_data, 5, 'nothing') the functions should return 100 because all of the 3 failed students did not complete the test preparation course. Note: the column numbers start from 1. That is, the first column is column 1, second column is column 2 and so on. Note: Your function should work for the whole data set. The above small snippet of the data set was used to explain the functionality of the function. Input: A table containing all the data that is available in the given data file, a column number and a category in that given column. Output: The percentage of failed students who belong to that category. For example: >>> exam_data = read_data('exams.txt') >>> add_average_score (exam_data) >>> get_percentage (exam_data, 2, 'A') 10.48 >>> get_percentage (exam_data, 2, 'C') 43.55 >>>get_percentage (exam_data, 3, 'HS') 24.19 >>> get_percentage (exam_data, 3, 'MD') 3.23 >>> get_percentage (exam_data, 4, 'R') 66.94 >>> get_percentage (exam_data, 5, 'nothing') 85.48 Task 4: Category percentages Write a function named category_percentages (table) that returns a table with the failure percentages for all the categories in columns 2 (ethnicity), 3 (parental education level), 4 (lunch type) and 5 (status of the test preparation course). Use the get_percentage (table, column, category) function from task 3 (don't re-write the code for percentage calculation). The output table of this function should have one row for each of the considered field (column) of the data set (ie. first row is for ethnicity, second row is for parental education level etc.). Each row of the output table contains the percentage values for each category of that field (ie. first row first column Note: When you add the percentages to the output table for each of the considered fields, follow the order given in task 1 part (a), (b) and (c) for the ethnicity, the parental education level and lunch type. For test preparation status, store the percentage of those who completed the preparation first, followed by those who did not. Please refer to the table below for the order of the fields (columns) and the order of the category for each field. Ethnicity A, B, C, D, E Parents' education (refer to task 1 for abbreviations). C, AD, HS, S, BD, MD For example: Lunch type Test preparation >>> exam_data = read_data('exams.txt') >>> add_average_score(exam_data) >>> category_percentages (exam_data) S, R Input: A table containing all the data that is available in the given data file, with the average score appended. Output: A table containing the failed percentages for each category (with one row per field). nothing, completed [[10.48, 20.16, 43.55, 16.94, 8.87], [25.81, 10.48, 24.19, 31.45, 4.84, 3.23], [33.06, 66.94], [85.48, 14.52]] Task 5: Write the results of the analysis to a separate text file Write a function named record_results (table, output_filename='analysis_results.txt') that writes the details of the failed percentages, into the given text file, output_filename. Add the title "Failed percentages" as the first line in the file. Note: You have to reuse the functions written in the previous tasks. Do not rewrite the code written in the previous tasks here. Input: A table containing all the data that is available in the given data file with the average score appended. Output: The given file updated with the details of the failed percentages. For example: >>> exam_data = read_data('exams.txt') >>> add_average_score(exam_data) >>> record_results(exam_data, 'analysis_results.txt') should create the analysis_results.txt file and store the results into the file as shown below. analysis_results.txt - Notepad File Edit Format View Help Failed percentages Ethnicity A, 10.48 B, 20.16 C,43.55 D, 16.94 E,8.87 Parent education level C, 25.81 AD, 10.48 HS, 24.19 S,31.45 BD,4.84 MD, 3.23 Lunch type 5,33.06 R, 66.94 Test preparation none, 85.48 completed, 14.52 Task 2: Average mark calculation Write a function named add_average_score (table), which calculates the average score of all three given scores for each student and append it to the end of the table (as the column next to the writing score). Make sure you round the average score to two decimal places. Note: Your function should NOT return a new table. It should append the new column to the given table (taken as the input to the function), instead. Input: A table containing all the student data that is available in the given data file (table) Output: The same table with the average score appended to the end of the table (for each row). For example: >>> exam_data read_data('exams.txt') >>> add_average_score (exam_data) >>> exam_data[:2] # The first two rows of the table [['male', 'A', 'HS', 'S', 'completed', 67.0, 67.0, 63.0, 65.67], ['female', 'D', 'S', 'R', 'nothing', 40.0, 59.0, 55.0, 51.33]] Analysis of failures You are going to do some analysis on the failed students to see what factors might be affecting their poor performance. You need to see if the ethnic group, parental education level, type of lunch and test preparation play a role in the performance outcome. Let us decompose the problem into two parts. Task 1: Read the data into a table Implement a function named read_data (filename), with the following specification, which reads a given file and returns the contents in a table. While reading the contents you need to carry out the following tasks before saving the contents to the table. a. Store the ethnic group using the letter only (ie. group A stored as A, group B stored as B etc.) Store a short form for the parental level of education as shown below. b. i. C for some college ii. AD for associate's degree iii. iv. HS for high school S for some high school V. BD for bachelor's degree vi. MD for master's degree c. Store a short form for lunch as shown below i. S for standard ii. R for free/reduced d. You need to convert all the numerical values to float. Hint: you may use the isalpha string method (you may assume none of the fields in the data file are alphanumeric). Input: The name of the data file (filename) Output: A table with all the rows of data in the given file. For example: >>> exam_data = read_data('exam.txt') >>> exam_data[:2] # The first two rows of the table [['male', 'A', 'HS', 'S', 'completed', 67.0, 67.0, 63.0], ['female', 'D', 'S', 'R', 'nothing', 40.0, 59.0, 55.0]] (Note: this is only for testing your code. The table you output should have all the rows of data).
Expert Answer:

Related Book For 

Posted Date:
Students also viewed these programming questions
-
The following additional information is available for the Dr. Ivan and Irene Incisor family from Chapters 1-5. Ivan's grandfather died and left a portfolio of municipal bonds. In 2012, they pay Ivan...
-
a. Show that if the position x of a moving point is given by a quadratic function of t, x = At 2 + Bt + C, then the average velocity over any time interval [t 1 , t 2 ] is equal to the instantaneous...
-
The National Association of Realtors publishes information on the cost of existing single-family homes in Median Sales Price of Existing Single-Family Homes for Metropolitan Areas. Independent random...
-
To test hearing at various frequencies, a resonant RLC circuit is connected to a speaker. The resonant frequency is selected by changing a variable capacitor. (a) For an RLC circuit with L = 300 mH,...
-
Water is siphoned from a large tank and discharges into the atmosphere through a 2-in.-diameter tube as shown in Fig. P3.95. The end of the tube is \(3 \mathrm{ft}\) below the tank bottom, and...
-
The following expenditures relating to plant assets were made by Devereaux Company during the first 2 months of 2014. 1. Paid $5,000 of accrued taxes at time plant site was acquired. 2. Paid $400...
-
The Denver Corporation has forecast the following sales for the first seven months of the year: January February $ 20,000 22,000 March 24,000 April 30,000 May 20,000 June July 26,000 28,000 Monthly...
-
George Pharmacy is a pharmaceutical salesman who has been very successful at his job in the last few years. Unfortunately, his family life has not been very happy. Three years ago, his only child,...
-
Explain how you would use the SARA Model writing
-
In Problems 19-22, apportion the indicated number of representatives to three states, A, B, and C, using Hamilton's plan. Next, use the revised populations to reapportion the representatives. Decide...
-
Consider a vote for four candidates with the following results: Use this information for Problems 9-11. If there is a tie, break the tie by having a runoff of the tied candidates. Who wins by the...
-
In Problems 23-26, apportion the indicated number of representatives to two states, A, and B, using Hamilton's plan. Next, recalculate the apportionment using Hamilton's plan for the three states,...
-
Find the standard divisor (to two decimal places) for the given populations and number of representative seats in Problems 15-22. Population 540 # Seats 7
-
The philosophy department is selecting a chairperson, and the candidates are Andersen (A), Bailey (B), and Clark (C). Here are the preferences of the 27 department members: a. Who is the Condorcet...
-
As off-balance sheet financing, project finance promises to provide alternative route to countries to fill infrastructure funding gap without increasing public debt levels . This is the case...
-
One Way Cellular accountants have assembled the following data for the year ended September 30, 2014: Prepare the operating activities section using the indirect method for One Way Cellulars...
-
The mean hourly manufacturing pay is shown in Table 15 for various years. Table 15 Mean Hourly Manufacturing Pay YearMean Hourly Pay (dollars) 19703.24 19807.15 199010.78 200014.32 201018.61...
-
A student thinks that if a line has slope 2 and contains the point64. (3, 5), then the equation of the line is y = 2x + 5, because the slope is 2 (the coefficient of x) and the y-coordinate of (3, 5)...
-
g(x) = 12(1/2)x Graph the function by hand. Find its domain and range.
-
Is the word anxiety a candidate for creating a stable pattern? If so, give reasons.
-
Define the real meaning of anxiety. What are the different meanings of this word?
-
Can you list six important benefits of this pattern?

Study smarter with the SolutionInn App