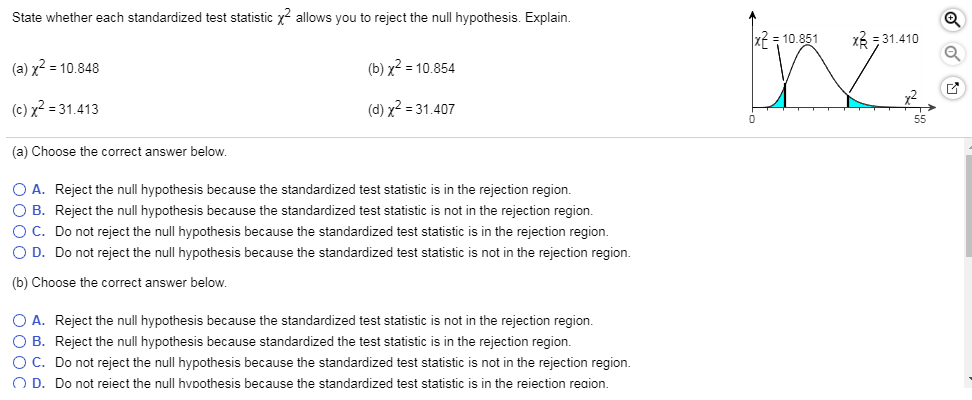
?? State whether each standardized test statistic x allows you to reject the null hypothesis. Explain. (a)
Fantastic news! We've Found the answer you've been seeking!
Question:
Transcribed Image Text:
State whether each standardized test statistic x² allows you to reject the null hypothesis. Explain. (a) x² = 10.848 (c) x² = 31.413 (b) x² = 10.854 (d) x² = 31.407 (a) Choose the correct answer below. O A. Reject the null hypothesis because the standardized test statistic is in the rejection region. O B. Reject the null hypothesis because the standardized test statistic is not in the rejection region. O C. Do not reject the null hypothesis because the standardized test statistic is in the rejection region. O D. Do not reject the null hypothesis because the standardized test statistic is not in the rejection region. (b) Choose the correct answer below. O A. Reject the null hypothesis because the standardized test statistic is not in the rejection region. O B. Reject the null hypothesis because standardized the test statistic is in the rejection region. O C. Do not reject the null hypothesis because the standardized test statistic is not in the rejection region. O D. Do not reiect the null hypothesis because the standardized test statistic is in the reiection region. x2 = 10.851 x3 = 31.410 W 55 (c) Choose the correct answer below. O A. Do not reject the null hypothesis because the standardized test statistic is not in the rejection region. B. Reject the null hypothesis because the standardized test statistic is not in the rejection region. C. Do not reject the null hypothesis because the standardized test statistic is in the rejection region. D. Reject the null hypothesis because the standardized test statistic is in the rejection region. (d) Choose the correct answer below. O A. Do not reject the null hypothesis because the standardized test statistic is in the rejection region. B. Reject the null hypothesis because the standardized test statistic is not in the rejection region. OC. Do not reject the null hypothesis because the standardized test statistic is not in the rejection region. O D. Reject the null hypothesis because the standardized test statistic is in the rejection region. State whether each standardized test statistic x² allows you to reject the null hypothesis. Explain. (a) x² = 10.848 (c) x² = 31.413 (b) x² = 10.854 (d) x² = 31.407 (a) Choose the correct answer below. O A. Reject the null hypothesis because the standardized test statistic is in the rejection region. O B. Reject the null hypothesis because the standardized test statistic is not in the rejection region. O C. Do not reject the null hypothesis because the standardized test statistic is in the rejection region. O D. Do not reject the null hypothesis because the standardized test statistic is not in the rejection region. (b) Choose the correct answer below. O A. Reject the null hypothesis because the standardized test statistic is not in the rejection region. O B. Reject the null hypothesis because standardized the test statistic is in the rejection region. O C. Do not reject the null hypothesis because the standardized test statistic is not in the rejection region. O D. Do not reiect the null hypothesis because the standardized test statistic is in the reiection region. x2 = 10.851 x3 = 31.410 W 55 (c) Choose the correct answer below. O A. Do not reject the null hypothesis because the standardized test statistic is not in the rejection region. B. Reject the null hypothesis because the standardized test statistic is not in the rejection region. C. Do not reject the null hypothesis because the standardized test statistic is in the rejection region. D. Reject the null hypothesis because the standardized test statistic is in the rejection region. (d) Choose the correct answer below. O A. Do not reject the null hypothesis because the standardized test statistic is in the rejection region. B. Reject the null hypothesis because the standardized test statistic is not in the rejection region. OC. Do not reject the null hypothesis because the standardized test statistic is not in the rejection region. O D. Reject the null hypothesis because the standardized test statistic is in the rejection region.
Expert Answer:
Answer rating: 100% (QA)
Here standaned stahiche Caulicul Juis teshy when tue the tesd statishre Now w... View the full answer
Related Book For
Elementary Statistics Picturing the World
ISBN: 978-0321911216
6th edition
Authors: Ron Larson, Betsy Farber
Posted Date:
Students also viewed these mathematics questions
-
In Exercises 11, state whether each standardized test statistic X2 allows you to reject the null hypothesis. Explain. (a) X2 = 2.091 (b) X2 = 0 (c) X2 = 1.086 (d) X2 = 6.3471 2 4 68 10 .-6.251
-
In Exercises 12, state whether each standardized test statistic X2 allows you to reject the null hypothesis. Explain. (a) X2 = 22.302 (b) X2 = 23.309 (c) X2 = 8.457 (d) X2 = 8.577 5 s 2025 30 2 =...
-
In Exercises 25, state whether each standardized test statistic z allows you to reject the null hypothesis. Explain your reasoning (a) z = -1.301 (b) z = 1.203 (c) z = 1.280 (d) z = 1.286 -3-2012 3 o...
-
Please solve all the letters, and please show all work indetail. If you use excel please show other excel box showing whatyou inputted in the excel boxes.. Thanks!!! 5. Growth opportunities. The firm...
-
(a) The hydrogen atoms attached to C3 of 1,4-pentadiene are unusually susceptible to abstraction by radicals. How can you account for this? (b) Can you provide an explanation for the fact that the...
-
An inexperienced accountant for Zoeng Company, Ltd. made the following errors in recording merchandising transactions. 1. A HK$1,750 refund to a customer for faulty merchandise was debited to Sales...
-
We can transform the log-optimal pricing formula into a risk-neutral pricing equation. From the log-optimal pricing equation we have \[P=\mathrm{E}\left(\frac{d}{R^{*}} ight)\] where $R^{*}$ is the...
-
Numerous studies have shown that watching too much television hurts school grades. Others have argued that television is not necessarily a bad thing for children (Mail Online, July 18, 2009). Like...
-
Calculate the predetermined over head rate assuring sandhill company estimates total manufacturing overhead costs of 1 0 0 8 0 0 0.
-
Use the same scale to construct boxplots for the full IQ scores (IQF) for the low lead level group (group 1) and the high lead level group (group 3) in Data Set 7 "IQ and Lead" in Appendix B. Use the...
-
Below is a supply and demand curve for spaghetti. Assume that the price of rice increases and the price of meatballs decreases. Shift the appropriate curve(s) to show how this news will affect the...
-
The provided sample data illustrates the annual sales and the average selling price of a product within a company from 2011 to 2017.. Average Sale Price Year Sales 2011 75,110 324,963 2012 84,488...
-
On January 1, 2023, WinnerWinner Ltd. paid $250 for the option to buy 1,000 common shares for $32 per share anytime between January 1 and April 30. The contract stipulates that it may only be settled...
-
02/01/2023 Pay $1,000 rent for February to Joseph Leasing by e-check. To record, select + New > Expense > 5028 Rent & Lease (Expenses). Save the transaction > select More > Transaction Journal. What...
-
Create two sets such that A x B = B x A . What are the elements of the A x B in this case?
-
Which function can be used to combine two or more separate spill ranges into a single dynamic array?
-
In a short essay, discuss the difference between efficiency and effectiveness. Include specific examples to support each concept. In a short essay, differentiate between the symbolic view and the...
-
Find the volume of the described solid S. A frustum of a right circular cone with height h, lower base radius R, and top radius r -r- --R
-
You research commute times to work and find that the population standard deviation is 9.3 minutes. Repeat Exercise 17, using the standard normal distribution with the appropriate calculations for a...
-
Explain how to test a population proportion p.
-
Number of classes: 5 Data set: Times (in minutes) spent reading a political blog in a day Construct a frequency distribution for the data set using the indicated number of classes. In the table,...
-
(a) Show that the variancecovariance matrix of the disturbances in (9.1) is given by (9.2). (b) Show that the two nonzero block matrices in (9.2) can be written as in (9.3). (c) Show that...
-
Consider the following unbalanced one-way analysis of variance model \[y_{i t}=\mu_{i}+u_{i t} \quad i=1, \ldots, N \quad t=1,2, \ldots, T_{i}\] where for simplicity's sake no explanatory variables...
-
Consider the three-way error component model described in problem 3.15. The panel data can be unbalanced and the matrices of dummy variables are \(\Delta=\left[\Delta_{1}, \Delta_{2}, \Delta_{3}...
Study smarter with the SolutionInn App