

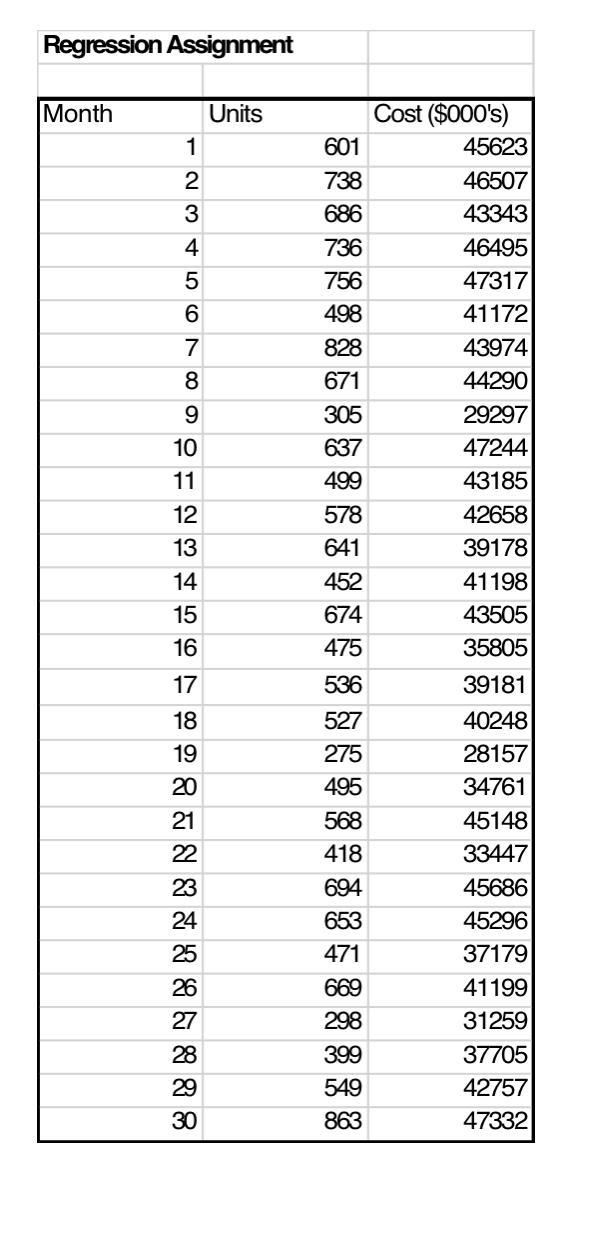
Simple Linear Regression The Public Service Electric Company produces different quantities of electricity each month depending...
Fantastic news! We've Found the answer you've been seeking!
Question:
Expert Answer:
The data given is the number of units electricity produced and the total cost pro... View the full answer

Related Book For 

Managerial Economics
ISBN: 978-1118808948
8th edition
Authors: William F. Samuelson, Stephen G. Marks
Posted Date:
