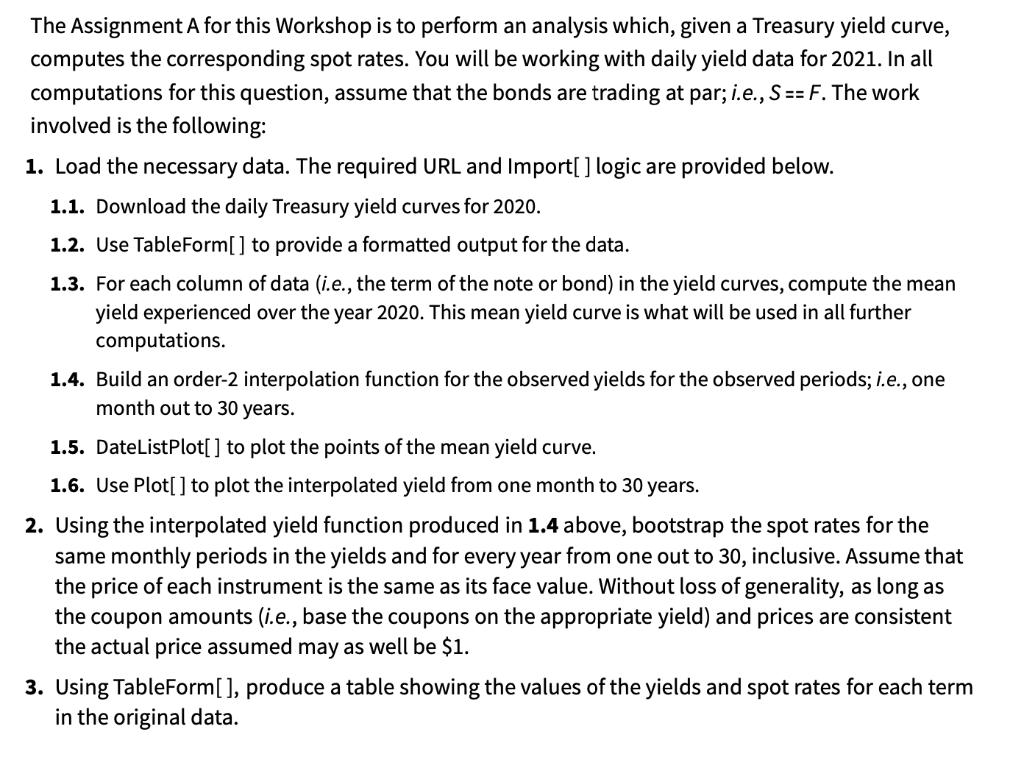
The Assignment A for this Workshop is to perform an analysis which, given a Treasury yield...
Fantastic news! We've Found the answer you've been seeking!
Question:
Transcribed Image Text:
The Assignment A for this Workshop is to perform an analysis which, given a Treasury yield curve, computes the corresponding spot rates. You will be working with daily yield data for 2021. In all computations for this question, assume that the bonds are trading at par; i.e., S == F. The work involved is the following: 1. Load the necessary data. The required URL and Import[] logic are provided below. 1.1. Download the daily Treasury yield curves for 2020. 1.2. Use TableForm[] to provide a formatted output for the data. 1.3. For each column of data (i.e., the term of the note or bond) in the yield curves, compute the mean yield experienced over the year 2020. This mean yield curve is what will be used in all further computations. 1.4. Build an order-2 interpolation function for the observed yields for the observed periods; i.e., one month out to 30 years. 1.5. DateListPlot[] to plot the points of the mean yield curve. 1.6. Use Plot[] to plot the interpolated yield from one month to 30 years. 2. Using the interpolated yield function produced in 1.4 above, bootstrap the spot rates for the same monthly periods in the yields and for every year from one out to 30, inclusive. Assume that the price of each instrument is the same as its face value. Without loss of generality, as long as the coupon amounts (i.e., base the coupons on the appropriate yield) and prices are consistent the actual price assumed may as well be $1. 3. Using TableForm [], produce a table showing the values of the yields and spot rates for each term in the original data. The Assignment A for this Workshop is to perform an analysis which, given a Treasury yield curve, computes the corresponding spot rates. You will be working with daily yield data for 2021. In all computations for this question, assume that the bonds are trading at par; i.e., S == F. The work involved is the following: 1. Load the necessary data. The required URL and Import[] logic are provided below. 1.1. Download the daily Treasury yield curves for 2020. 1.2. Use TableForm[] to provide a formatted output for the data. 1.3. For each column of data (i.e., the term of the note or bond) in the yield curves, compute the mean yield experienced over the year 2020. This mean yield curve is what will be used in all further computations. 1.4. Build an order-2 interpolation function for the observed yields for the observed periods; i.e., one month out to 30 years. 1.5. DateListPlot[] to plot the points of the mean yield curve. 1.6. Use Plot[] to plot the interpolated yield from one month to 30 years. 2. Using the interpolated yield function produced in 1.4 above, bootstrap the spot rates for the same monthly periods in the yields and for every year from one out to 30, inclusive. Assume that the price of each instrument is the same as its face value. Without loss of generality, as long as the coupon amounts (i.e., base the coupons on the appropriate yield) and prices are consistent the actual price assumed may as well be $1. 3. Using TableForm [], produce a table showing the values of the yields and spot rates for each term in the original data.
Expert Answer:
Answer rating: 100% (QA)
To perform the analysis and compute the spot rates for the given Treasury yield curve data we will follow the steps outlined in the assignment Step 1 ... View the full answer
Posted Date:
Students also viewed these accounting questions
-
This task requires you to apply your knowledge to the start-up business you will establish as part of your final business plan. Part A enables you to prepare budgets for a business in Australia. ...
-
Jana doesnt plan to issue new shares of common stock. Using the CAPM approach, what is Jana's estimated cost of equity? (2 points) The CAPM Approach r s = Risk-free rate + (Market risk premium)...
-
You will be working with a real company or a fictitious one of your own creation that is in a market domain or segment of an industry with which you are familiar. Examples of industries include...
-
Explain why a safety net can save the life of a circus performer.
-
The demand for intensive care services in an urban hospital is 11 patients per hour on Mondays while intensive care nurses can handle 4 patients per hour. What is nurse (labor) utilization if five...
-
Why is it important for an international manager to understand the balance of payments?
-
How much energy is dissipated in the collision of Checkpoint 7.11? Data from Checkpoint 7.11 A 1000-kg compact car and a \(2000-\mathrm{kg}\) van, each traveling at \(25 \mathrm{~m} / \mathrm{s}\),...
-
Selected data for Finanka, a Finnish cellular phone manufacturer, appear below (amounts in millions of euros): a. Compute the amount of cash flow from operations for each of the four years using the...
-
4 16. The mean and variance of a binomial distribution area and respectively. If P(X = 1) = then P(X = 4 or 5) is equal to: 243 (a) 1/159 64 (b) $ 16 (c) 81 925 145 (d) 27 243 17. Let E1, E2, E3 be...
-
APC, Inc is a venture capital firm that invests in new businesses to help them grow. Wyatt Newark owns and serves as a chef at Earp's, a restaurant with a Western design that he operates as a sole...
-
Calculus evaluate 1. dx/(x^2+4) 2. sin (1-x) (2-cos(1-x) )^4 dx
-
Use an \(F\)-test to jointly test the relevance of the two variables \(X T R A \_X 5\) and \(X T R A \_X 6\) for the family income equation in Example 6.12 and Table 6.1. Data From Example 6.12:- To...
-
\(x_{1}=371, n_{1}=509, x_{2}=434, n_{2}=579,95 \%\) confidence Construct a confidence interval for \(p_{1}-p_{2}\) at the given level of confidence.
-
In 1985, the state of Tennessee carried out a statewide experiment with primary school students. Teachers and students were randomly assigned to be in a regular-sized class or a small class. The...
-
Test whether \(p_{1} > p_{2}\). Sample data: \(x_{1}=28, n_{1}=254\), \(x_{2}=36, n_{2}=302\), where \(\alpha=0.010\). Conduct each test at the \(\alpha\) level of significance by determining (a) the...
-
\(H_{0}: p=0.6\) versus \(H_{1}: p <0.6\) \(n=250 ; x=124 ; \alpha=0.01\) Test the hypothesis using (a) the classical approach and (b) the P-value approach. Be sure to verify the requirements of the...
-
Tasks and Results to be mentioned in the report 1. Fill up the table below for available control systems. Mention four process control systems available with the station. Mention the final control...
-
Consider the reaction of acetic acid in water CH 3 CO 2 H(aq) + H 2 O(l) CH3CO 22 (aq) + H 3 O + (aq) where Ka 5 1.8 3 1025. a. Which two bases are competing for the proton? b. Which is the stronger...
-
Using an Internet-based search on 'build operate transfer," find an additional definition from a source other than used in Section 14.2. Copy and paste it, as well as any graphics, examples,...
-
Elm City is considering a replacement for its police radio. The benefits and costs of the replacement are shown below. What is the replacement's benefit/cost ratio if the effective annual interest...
-
True or False: Benefits and disbenefits must be converted to monetary values to use benefit-cost analysis.
Study smarter with the SolutionInn App