

The Beer?s Law plot is one of the most useful for a quantitative analytical chemist. Examine the
Question:
The Beer?s Law plot is one of the most useful for a quantitative analytical chemist. Examine the following Beer?s Law plot.
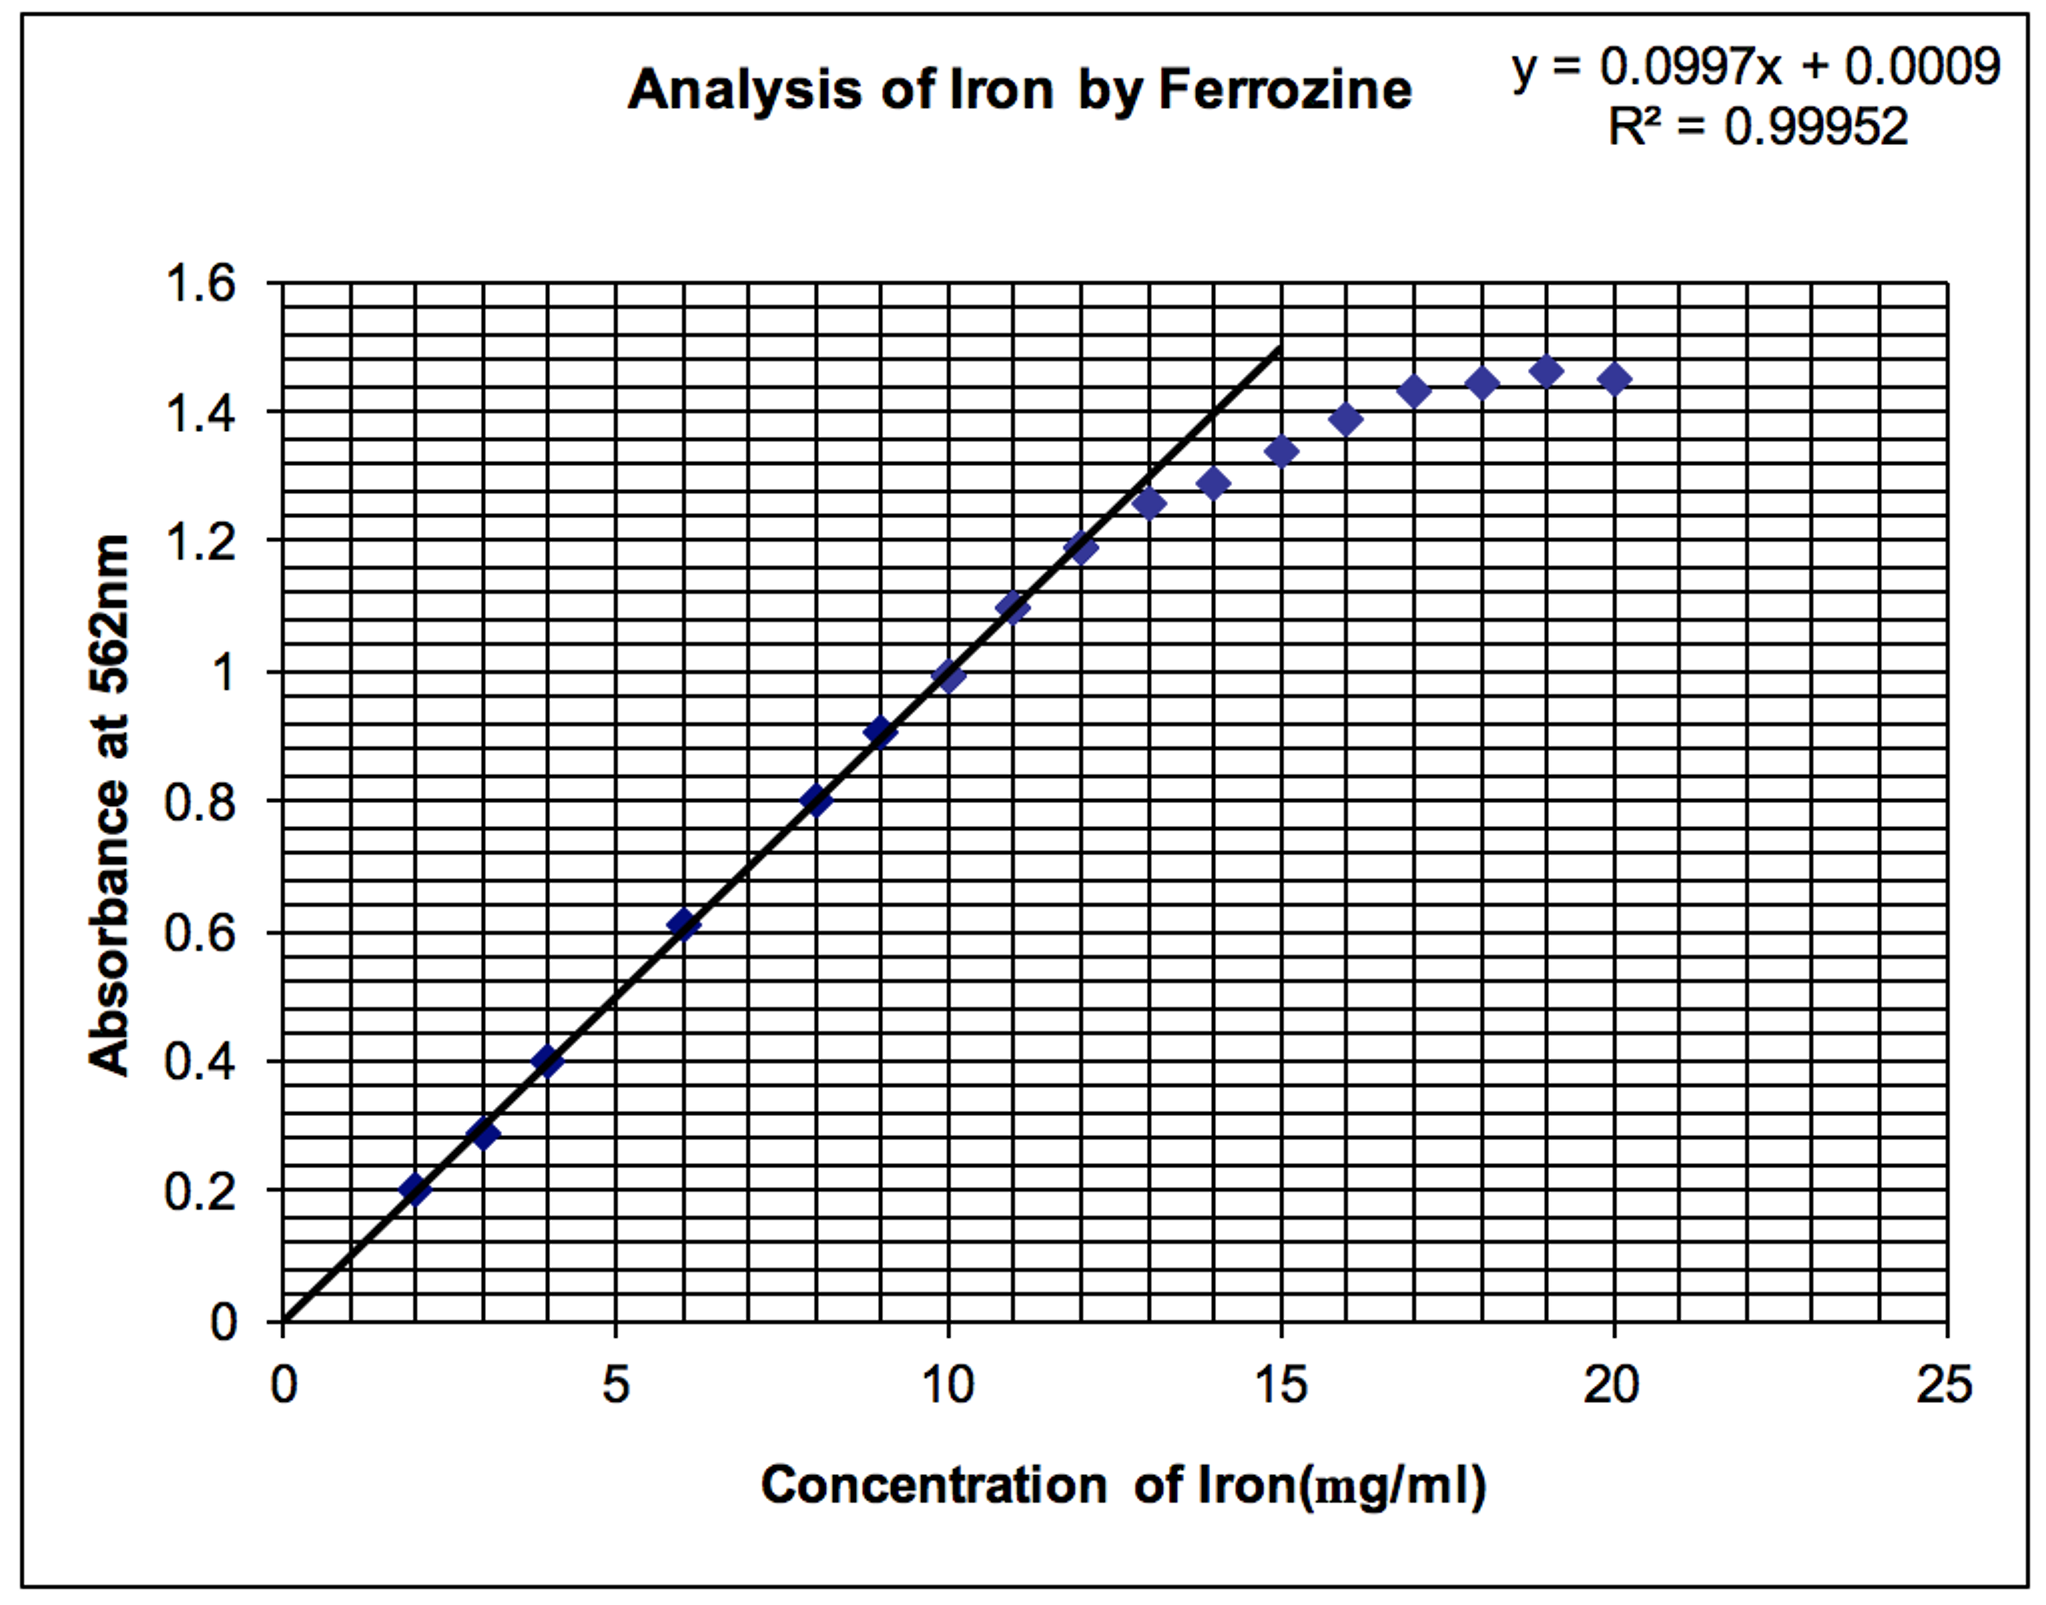
a. What chemical and physical reasons (there are both) cause the calibration curve to flatten at high concentrations and absorbances?
b. Given the equation of the line, what is the concentration of the sample if the absorbance is 0.743 absorbance units?
c. The sample was prepared by taking a 10 mL sample from the stock solution and diluting it to 100mL. What is the concentration of the stock solution based on your answer from part b?
d. What is the molar absorptivity for the iron complex (assume that the Fe: complex ratio is 1:1) at this wavelength? You may assume that the path length is 1.00 cm.
Expert Answer:


Financial Accounting Information For Decisions
ISBN: 978-0324672701
6th Edition
Authors: Robert w Ingram, Thomas L Albright
