The Cape Retirement Fund may only invest in the asset classes for which returns have been provided.
Question:
The Cape Retirement Fund may only invest in the asset classes for which returns have been provided. The Investment Consultants and Trustees of the Fund have indicated that the risk and return requirements of the Fund indicate that exposures (weights) to the asset classes must, at all times, be constrained as follows:
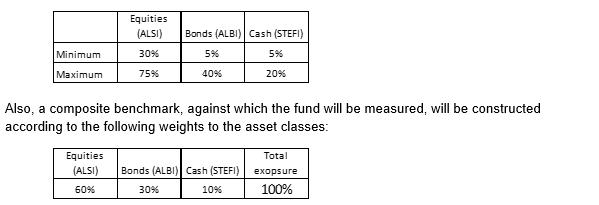
You (and your team) have been appointed as the portfolio manager for the fund and must present your proposal as to how you will construct the investment to ensure an optimal portfolio. The portfolio construction will be based on an asset allocation “mix” that will apply to the whole period (i.e. one optimal asset allocation must be determined for the 6-year period).
Since you are aware of the several weaknesses in optimization models, particularly the potential error maximizing, you have decided to generate/simulate at least one thousand different possible allocations to the asset classes (ensuring that the constraints are adhered to) to examine the possible return and risk profiles of the different asset class allocations. The Trustees have insisted that you use Beta (as per the CAPM model) and standard deviation as your risk measures relative to the benchmark portfolio. In addition, they insist that the portfolio Beta (relative to the benchmark portfolio) may not vary by more than 0.30 above or below the Beta of the benchmark portfolio.
- Your presentation must show your graph (based on your results using the data provided) in which you clearly indicate the minimum variance portfolio and the optimal portfolio – clearly indicate the Capital Market Line. Use standard deviation and beta as your risk statistics ensuring that each is presented in separate graphs.
B. Show your recommended optimal portfolio based on the use of the Beta constraints indicated by the Trustees.
C. Motivate your final proposed optimal portfolio that you believe will best meet the needs of the Fund.
Please find the data below:
| Date | SA Equity | SA Bond | SA Cash |
| 31-Jan-08 | -5.6% | -0.5% | 1.0% |
| 29-Feb-08 | 12.5% | -0.8% | 0.8% |
| 31-Mar-08 | -3.0% | -0.5% | 0.9% |
| 30-Apr-08 | 4.2% | -0.7% | 0.9% |
| 31-May-08 | 3.7% | -2.5% | 0.9% |
| 30-Jun-08 | -4.4% | -1.7% | 0.9% |
| 31-Jul-08 | -8.7% | 8.5% | 1.1% |
| 31-Aug-08 | 0.3% | 1.3% | 0.9% |
| 30-Sep-08 | -13.2% | 2.4% | 1.0% |
| 31-Oct-08 | -11.6% | -0.5% | 1.0% |
| 30-Nov-08 | 1.3% | 4.6% | 0.9% |
| 31-Dec-08 | 1.5% | 6.9% | 1.0% |
| 31-Jan-09 | -4.2% | -2.4% | 0.9% |
| 28-Feb-09 | -9.9% | -2.9% | 0.8% |
| 31-Mar-09 | 11.0% | 0.0% | 0.9% |
| 30-Apr-09 | 1.6% | 1.0% | 0.8% |
| 31-May-09 | 10.3% | -0.4% | 0.7% |
| 30-Jun-09 | -3.1% | -0.2% | 0.7% |
| 31-Jul-09 | 10.1% | 1.3% | 0.7% |
| 31-Aug-09 | 3.2% | 1.6% | 0.7% |
| 30-Sep-09 | 0.2% | 0.1% | 0.6% |
| 31-Oct-09 | 6.0% | -0.2% | 0.6% |
| 30-Nov-09 | 2.1% | 0.1% | 0.6% |
| 31-Dec-09 | 2.9% | 1.2% | 0.6% |
Expert Answer: