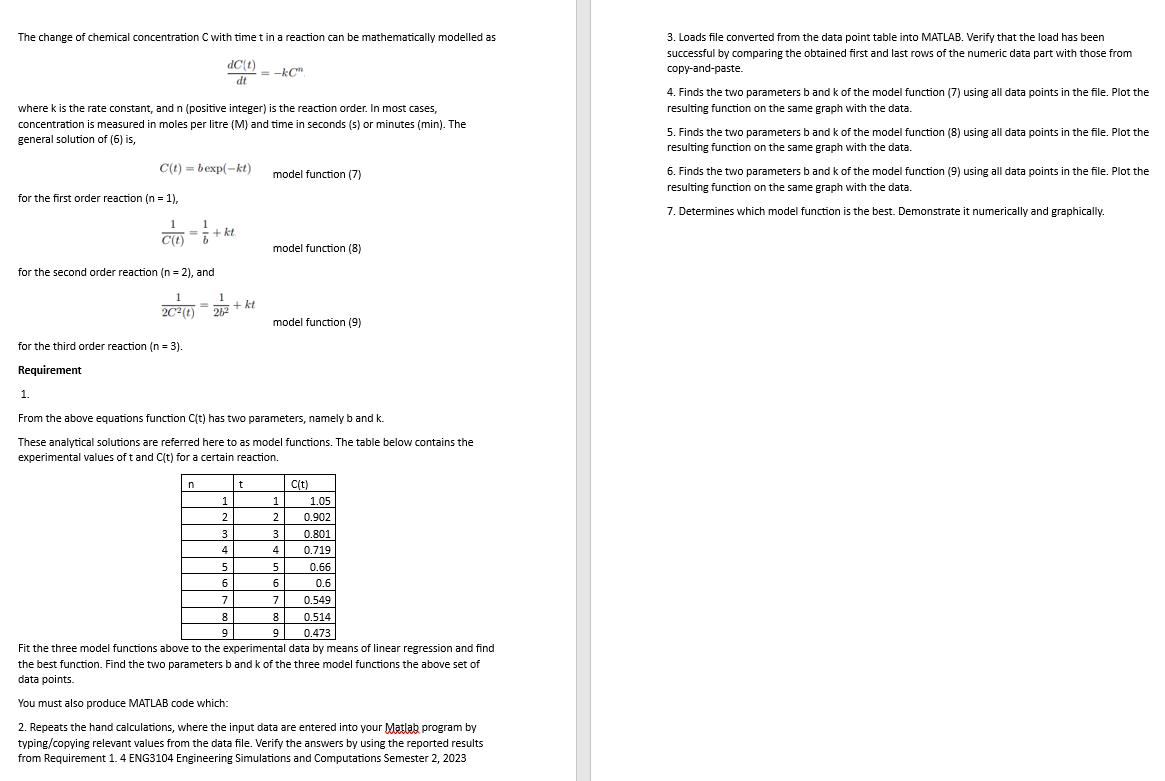
The change of chemical concentration C with time t in a reaction can be mathematically modelled...
Fantastic news! We've Found the answer you've been seeking!
Question:
Transcribed Image Text:
The change of chemical concentration C with time t in a reaction can be mathematically modelled as dC(t) dt where k is the rate constant, and n (positive integer) is the reaction order. In most cases, concentration is measured in moles per litre (M) and time in seconds (s) or minutes (min). The general solution of (6) is, C(t) = bexp(-kt) for the first order reaction (n = 1), 1 C(t) 1 20² (1) for the second order reaction (n = 2), and for the third order reaction (n = 3). Requirement 1 b + kt n 1 = = + kt 262 1 2 3 ^ 4 1. From the above equations function C(t) has two parameters, namely b and k. These analytical solutions are referred here to as model functions. The table below contains the experimental values of t and C(t) for a certain reaction. r =-kC" 5 6 7 8 9 t model function (7) model function (8) model function (9) 1 2 3 A 4 5 6 7 8 9 C(t) 1.05 0.902 0.801 0.719 0.66 0.6 0.549 0.514 0.473 Fit the three model functions above to the experimental data by means of linear regression and find the best function. Find the two parameters b and k of the three model functions the above set of data points. You must also produce MATLAB code which: 2. Repeats the hand calculations, where the input data are entered into your Matlab program by typing/copying relevant values from the data file. Verify the answers by using the reported results from Requirement 1.4 ENG3104 Engineering Simulations and Computations Semester 2, 2023 3. Loads file converted from the data point table into MATLAB. Verify that the load has been successful by comparing the obtained first and last rows of the numeric data part with those from copy-and-paste. 4. Finds the two parameters b and k of the model function (7) using all data points in the file. Plot the resulting function on the same graph with the data. 5. Finds the two parameters b and k of the model function (8) using all data points in the file. Plot the resulting function on the same graph with the data. 6. Finds the two parameters b and k of the model function (9) using all data points in the file. Plot the resulting function on the same graph with the data. 7. Determines which model function is the best. Demonstrate it numerically and graphically. The change of chemical concentration C with time t in a reaction can be mathematically modelled as dC(t) dt where k is the rate constant, and n (positive integer) is the reaction order. In most cases, concentration is measured in moles per litre (M) and time in seconds (s) or minutes (min). The general solution of (6) is, C(t) = bexp(-kt) for the first order reaction (n = 1), 1 C(t) 1 20² (1) for the second order reaction (n = 2), and for the third order reaction (n = 3). Requirement 1 b + kt n 1 = = + kt 262 1 2 3 ^ 4 1. From the above equations function C(t) has two parameters, namely b and k. These analytical solutions are referred here to as model functions. The table below contains the experimental values of t and C(t) for a certain reaction. r =-kC" 5 6 7 8 9 t model function (7) model function (8) model function (9) 1 2 3 A 4 5 6 7 8 9 C(t) 1.05 0.902 0.801 0.719 0.66 0.6 0.549 0.514 0.473 Fit the three model functions above to the experimental data by means of linear regression and find the best function. Find the two parameters b and k of the three model functions the above set of data points. You must also produce MATLAB code which: 2. Repeats the hand calculations, where the input data are entered into your Matlab program by typing/copying relevant values from the data file. Verify the answers by using the reported results from Requirement 1.4 ENG3104 Engineering Simulations and Computations Semester 2, 2023 3. Loads file converted from the data point table into MATLAB. Verify that the load has been successful by comparing the obtained first and last rows of the numeric data part with those from copy-and-paste. 4. Finds the two parameters b and k of the model function (7) using all data points in the file. Plot the resulting function on the same graph with the data. 5. Finds the two parameters b and k of the model function (8) using all data points in the file. Plot the resulting function on the same graph with the data. 6. Finds the two parameters b and k of the model function (9) using all data points in the file. Plot the resulting function on the same graph with the data. 7. Determines which model function is the best. Demonstrate it numerically and graphically.
Expert Answer:
Answer rating: 100% (QA)
1 General Guidance The answer will be provided in step by step manner 2 Step by step Please note tha... View the full answer
Related Book For
Posted Date:
Students also viewed these databases questions
-
a. Example 13-1: Batch Reactor with an Exothermic Reaction Wolfram 1. Adiabatic Case: Use Wolfram to see whether you can find a trajectory that is ready to ignite and whose trajectory looks like a...
-
(a) LEP Table 12-2: Exothermic Reaction with Heat Exchange Download the Polymath, MATLAB, Python, or Wolfram codes for the algorithm and data given in Table T12-2 for the exothermic gas phase...
-
A proposed project has fixed costs of $84,000 per year. The operating cash flow at 7,500 units is $93,000. Ignoring the effect of taxes, what is the degree of operating leverage? If units sold rise...
-
You have been hired by the IMF to design a program to improve the current account balance. How should your program influence the following variables (increase/decrease): (a) Taxes (b) Government...
-
Is it appropriate to describe each of the following as a conjugate acidbase pair? Explain. (a) HCO 3 - and CO 3 2- ; (b) HSO 3 - and SO 4 2- ; (c) H 2 CO 3 and H 2 C 2 O 4 ; (d) HClO and ClO - ; (e)...
-
To check on an ambulance service's claim that at least \(40 \%\) of its calls are life-threatening emergencies, a random sample was taken from its files, and it was found that only 49 of 150 calls...
-
Walcker Transportation Companys general manager reports quarterly to the company president on the firms operating performance. The company uses a budget based on detailed expectations for the...
-
Your company recently hired a new administrative assistant, Maryam Arjmand. On her first day, you stopped by her desk to meet her. During your conversation, you told her to let you know if there was...
-
Wildcat, Incorporated, has estimated sales (in millions) for the next four quarters as follows: Sales Q1 $ 155 Q2 Q4 Q3 $175 $195 $ 225 Sales for the first quarter of the year after this one are...
-
(8%) Problem 1: The electric field in a certain region is given by the function = Ak cos (kx) cos (by) Absin (kx) sin (by) where A = 5.01 N m/C, k = 0.251 m, and b = 1.03 m. The points in the figure...
-
Saskatoon Dinner Company produces 'take - away' lunches, which it sells for $ 2 0 each. During the current month, the company produced 2 , 8 0 0 meals, but only sold 2 , 7 0 0 meals. The variable...
-
Griffin buys and sells ladies handbags. The average selling price is $ 4 1 0 per bag. Average variable costs ( purchase price of bags plus freight costs and selling expenses ) amounts to $ 1 9 0 per...
-
Saleena was hired and agreed to a $48.50 per hour compensation, for a regular 44 hour work week. Calculate her net earnings for the year. (10 marks) Federal Tax Brackets In Canada 2022 Federal Tax...
-
What quality assurance protocols do you employ to test and validate data integrity in software applications and databases ?
-
A company pays $ 5 , 0 0 0 for equipment. Annual depreciation on the equipment is $ 5 0 0 . What is the book value of the equipment at the end of Year 2 ?
-
Below are several transactions for Meyers Corporation for 2021. Issue common stock for cash, $60,000. Purchase building and land with cash, $45,000. Provide services to customers on account, $8,000....
-
A condenser (heat exchanger) brings 1 kg/s water flow at 10 kPa quality 95% to saturated liquid at 10 kPa, as shown in Fig. P4.91. The cooling is done by lake water at 20C that returns to the lake at...
-
An RTD analysis was carried out on a liquid-phase reactor (Chem. Eng. J. 1, 76 (1970)). Analyze the following data: a. Plot the E(t) curve for these data. b. What fraction of the material spends...
-
Consider the application of the PSSH to epidemiology. We shall treat each of the following steps as elementary, in that the rate will be proportional to the number of people in a particular state of...
-
Solar energy capture has great potential to help meet the worlds growing energy demand, which is 12 terawatts in 2010 and is expected to rise to 36 terawatts in 2050. Professor Al Weiner and his...
-
A company with a price-earnings ratio of 14 has an earnings yield closest to: A. 7.14% B. 14.00% C. 92.86%
-
Which of the following is not produced by a company to communicate its financial results? A. Schedule 13D. B. Annual report. C. 10-K statement.
-
The role of the 8-K filing with the Securities and Exchange Commission is best described as to disclose: A. the annual report. B. executive compensation. C. holdings of beneficial owners.
Study smarter with the SolutionInn App