

The contingency table shown to the right gives a cross-classification of a random sample of values...
Fantastic news! We've Found the answer you've been seeking!
Question:
Transcribed Image Text:
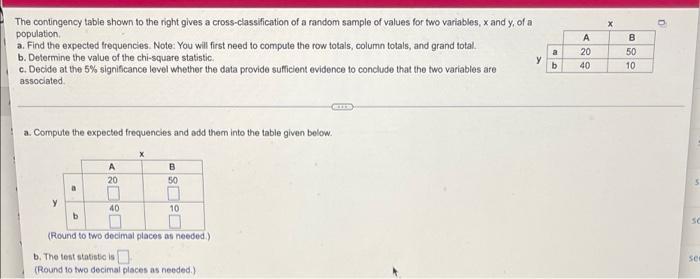
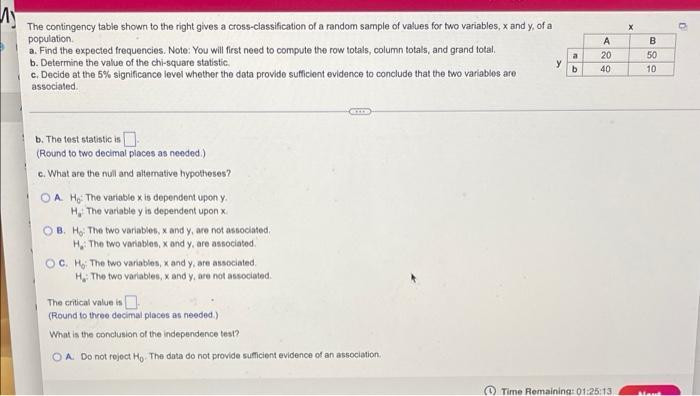
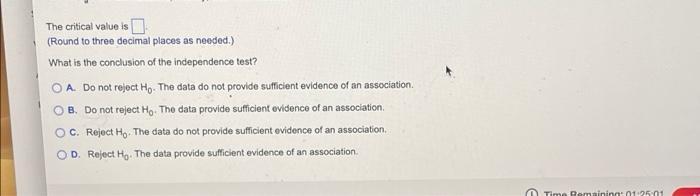
The contingency table shown to the right gives a cross-classification of a random sample of values for two variables, x and y, of a population. a. Find the expected frequencies. Note: You will first need to compute the row totals, column totals, and grand total. b. Determine the value of the chi-square statistic. c. Decide at the 5% significance level whether the data provide sufficient evidence to conclude that the two variables are associated. a. Compute the expected frequencies and add them into the table given below. a b A 20 40 X B 50 10 CELES (Round to two decimal places as needed.) b. The test statistic is (Round to two decimal places as needed.) y a b A 20 40 x B 50 10 SC ser The contingency table shown to the right gives a cross-classification of a random sample of values for two variables, x and y, of a population. a. Find the expected frequencies. Note: You will first need to compute the row totals, column totals, and grand total, b. Determine the value of the chi-square statistic. c. Decide at the 5% significance level whether the data provide sufficient evidence to conclude that the two variables are associated. b. The test statistic is (Round to two decimal places as needed.) c. What are the null and alternative hypotheses? OA H: The variable x is dependent upon y. H, The variable y is dependent upon x. OB. H: The two variables, x and y, are not associated. H: The two variables, x and y, are associated. OC. H: The two variables, x and y, are associated. H: The two variables, x and y, are not associated. The critical value is (Round to three decimal places as needed.) What is the conclusion of the independence test? OA. Do not reject Ho. The data do not provide sufficient evidence of an association. y a b > A 20 40 Time Remaining: 01:25:13 X B 50 10 Maul The critical value is (Round to three decimal places as needed.) What is the conclusion of the independence test? A. Do not reject Ho. The data do not provide sufficient evidence of an association. OB. Do not reject Ho. The data provide sufficient evidence of an association. OC. Reject Ho. The data do not provide sufficient evidence of an association. OD. Reject Ho. The data provide sufficient evidence of an association. Time Remaining:01:25:01 The contingency table shown to the right gives a cross-classification of a random sample of values for two variables, x and y, of a population. a. Find the expected frequencies. Note: You will first need to compute the row totals, column totals, and grand total. b. Determine the value of the chi-square statistic. c. Decide at the 5% significance level whether the data provide sufficient evidence to conclude that the two variables are associated. a. Compute the expected frequencies and add them into the table given below. a b A 20 40 X B 50 10 CELES (Round to two decimal places as needed.) b. The test statistic is (Round to two decimal places as needed.) y a b A 20 40 x B 50 10 SC ser The contingency table shown to the right gives a cross-classification of a random sample of values for two variables, x and y, of a population. a. Find the expected frequencies. Note: You will first need to compute the row totals, column totals, and grand total, b. Determine the value of the chi-square statistic. c. Decide at the 5% significance level whether the data provide sufficient evidence to conclude that the two variables are associated. b. The test statistic is (Round to two decimal places as needed.) c. What are the null and alternative hypotheses? OA H: The variable x is dependent upon y. H, The variable y is dependent upon x. OB. H: The two variables, x and y, are not associated. H: The two variables, x and y, are associated. OC. H: The two variables, x and y, are associated. H: The two variables, x and y, are not associated. The critical value is (Round to three decimal places as needed.) What is the conclusion of the independence test? OA. Do not reject Ho. The data do not provide sufficient evidence of an association. y a b > A 20 40 Time Remaining: 01:25:13 X B 50 10 Maul The critical value is (Round to three decimal places as needed.) What is the conclusion of the independence test? A. Do not reject Ho. The data do not provide sufficient evidence of an association. OB. Do not reject Ho. The data provide sufficient evidence of an association. OC. Reject Ho. The data do not provide sufficient evidence of an association. OD. Reject Ho. The data provide sufficient evidence of an association. Time Remaining:01:25:01
Expert Answer:

Related Book For 
Posted Date:
Students also viewed these accounting questions
-
Two variables x and y have a positive association if large values of .r am associated with large values of y. Write an equivalent definition that describes what small values of x are associated with....
-
Two random variables X and Y have, x = 2, y = 1, x = 1, y = 4, and p X,Y = 1 / 4. Let U = X + 2Y and V = 2X Y. Find the following quantities: (a) E [U] and E [V]; (b) E [U] , and E [V2]; (c) E [UV],...
-
The random variables X and Y have joint density function f (x, y) = 12xy(1 x) 0 < x < 1, 0 < y < 1 and equal to 0 otherwise. (a) Are X and Y independent? (b) Find E[X]. (c) Find E[Y]. (d) Find...
-
Conduct some additional research to learn more about Fabletics. How is Fabletics meeting customer needs through its value delivery network? What controversy surrounds the company? What type of...
-
For each of the following situations, explain whether a deduction should be allowed for entertainment expenses: a. Neil owns a real estate agency and has an annual Christmas party at his house. The...
-
Given that you are college student and reading the textbook, you are probably working on a degree.Think about completing college project a big project lasting many years and costing more than you...
-
Discuss the uses and limitations of the statement of financial position for decision-making purposes.
-
Abernathy, Inc., produces two different generators and is concerned about their quality. The company has identified the following quality activities and costs associated with the two products:...
-
The typical 19" wheel on a car has a moment of inertia of 3.1 kg m2. Defining counterclockwise motion as positive, answer the following questions; each of these is its own separate calculation, the...
-
Constructing a distribution of demand during reorder lead time is complicated if the lead time itself is variable. Consider the following distribution for a reorder point inventory system. a. What is...
-
Mary's Burger is a family-run fast food joint. In addition to its famous hamburger, Mary's Burger has just launched a new "Organic Beef burger. The owner, Mary, would like to know if her customers...
-
The city district attorney has 30 litigators to be divided among three courts. The following table shows the schedule of the number of pending cases for each court. Apportion the 30 litigators using...
-
The seniors at Weseltown High School are voting for where to go for their senior trip. They are deciding on Angel Falls (A), Bend Canyon (B), Cedar Lake (C), or Danger Gap (D). The results of the...
-
The city district attorney has 60 litigators to be divided among three courts. The following table shows the schedule of the number of pending cases for each court. Suppose that a fourth court is...
-
Determine the winner, if any, using the voting methods in Problems 29-34. Pairwise comparison method In voting among three candidates, the outcomes are reported as: (CBA) (ACB) (BAC) (BCA) (CAB) 3 0...
-
The seniors at Weseltown High School are voting for where to go for their senior trip. They are deciding on Angel Falls (A), Bend Canyon (B), Cedar Lake (C), or Danger Gap (D). The results of the...
-
Indentured servants All served the same number of ears regardless of age or experience Were working off the coast of their passage to America Usually lived long enough to compete their terms of...
-
What are the six activities involved in the physical supply/distribution system?
-
1. Sample size: n = 50. Relative frequencies: 0.20, 0.20, 0.25, 0.30, 0.05. 2. Sample size: n = 50. Relative frequencies: 0.22, 0.21, 0.25, 0.30, 0.02. We have given the relative frequencies for the...
-
Margin of error = 0.02; confidence level = 95%; educated guess = 0.6 a. Obtain a sample size that will ensure a margin of error of at most the one specified (provided of course that the observed...
-
Does the sample size have an effect on the standard deviation of all possible sample means? Explain your answer.
-
True or False. In the matrix iteration method, any computational error will not yield incorrect results.
-
A uniform simply supported beam carries two masses \(m_{1}\) and \(m_{2}\) with \(m_{2}=3 m_{1}\) as shown in Fig. 7.12. Find the fundamental natural frequency of the beam using Dunkerley's method....
-
Using Rayleigh's method, find the fundamental natural frequency of the torsional system shown in Fig. 6.11. Assume that \(J_{1}=J_{0}, J_{2}=2 J_{0}, J_{3}=3 J_{0}\), and \(k_{t 1}=k_{t 2}=k_{t...

Study smarter with the SolutionInn App