

The crude birth rate (cbr) is defined as the ratio of the number of births in...
Fantastic news! We've Found the answer you've been seeking!
Question:

Transcribed Image Text:
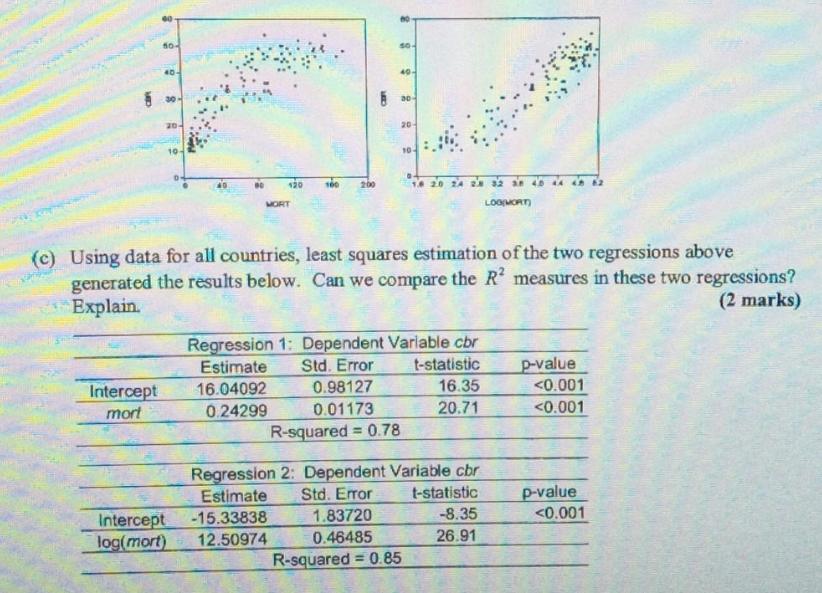
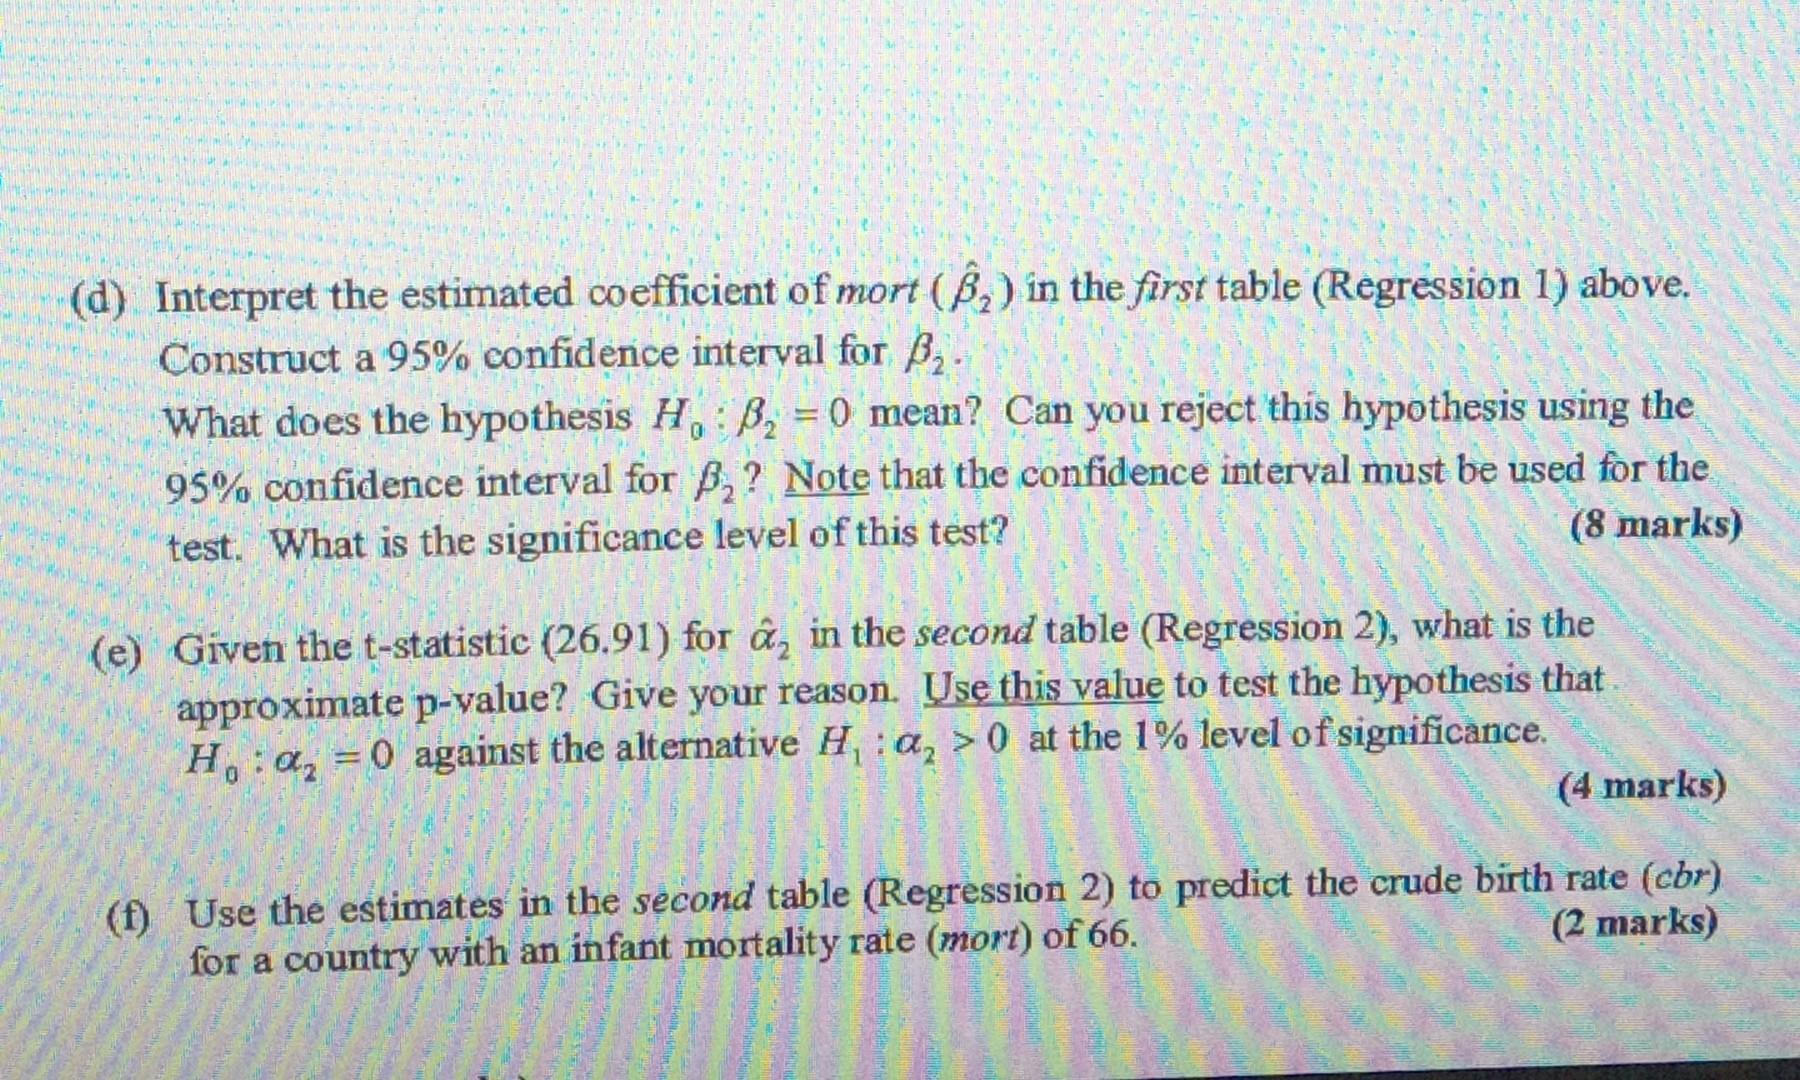
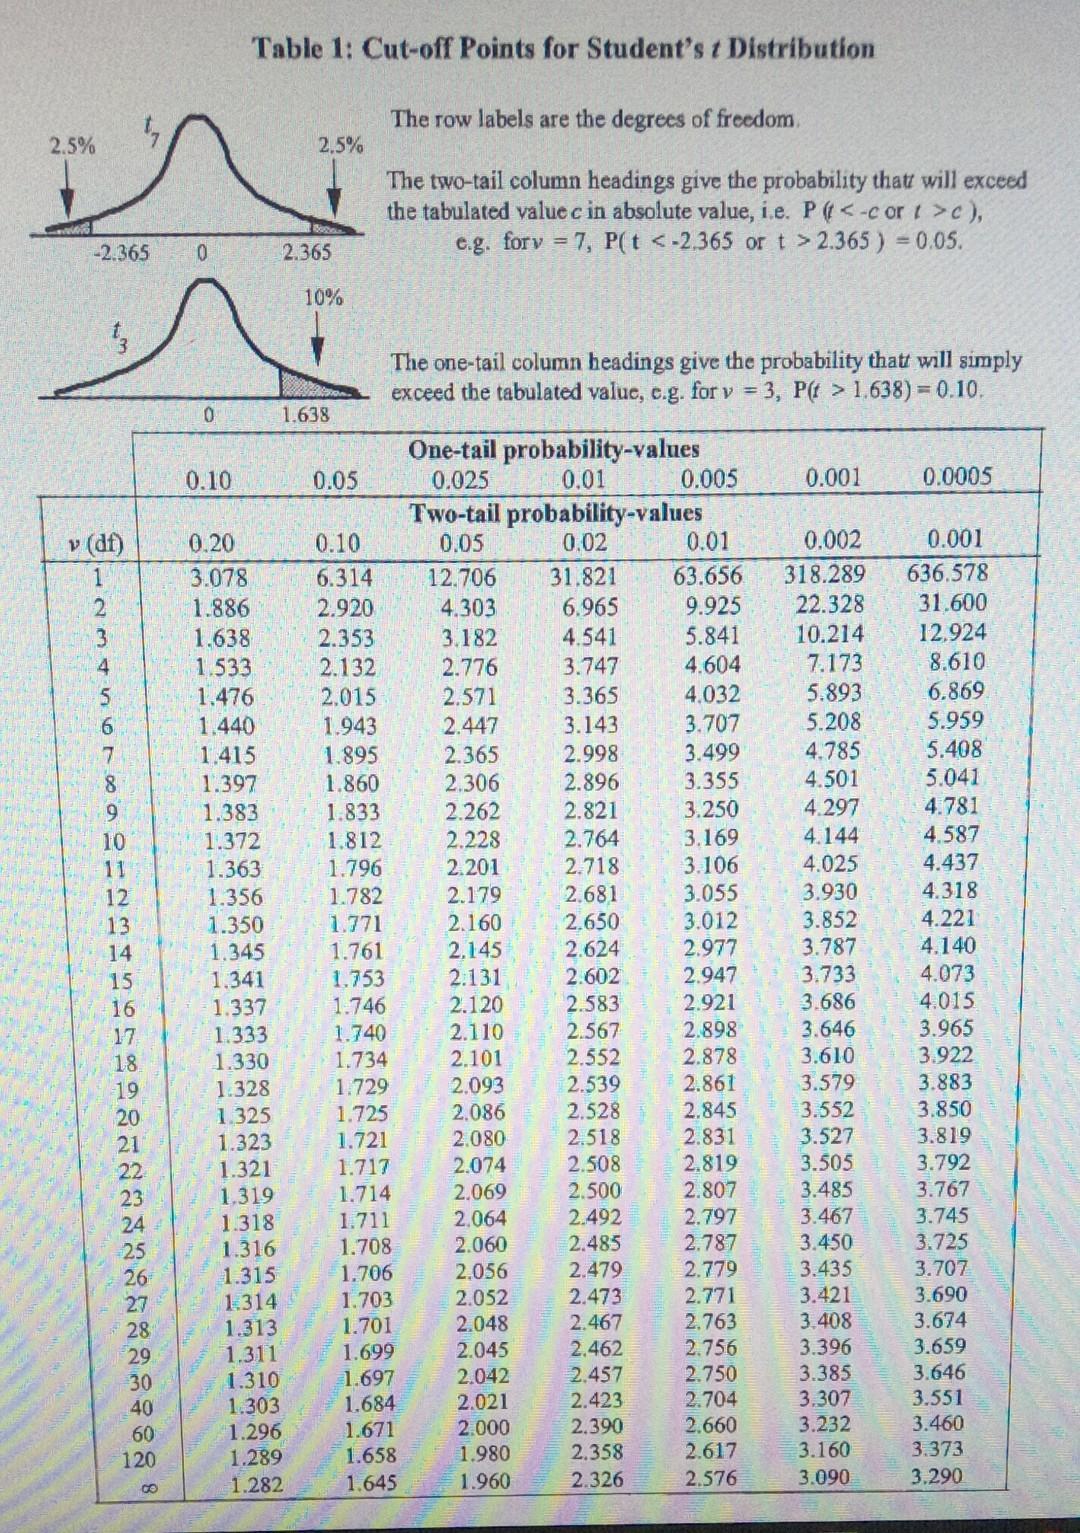
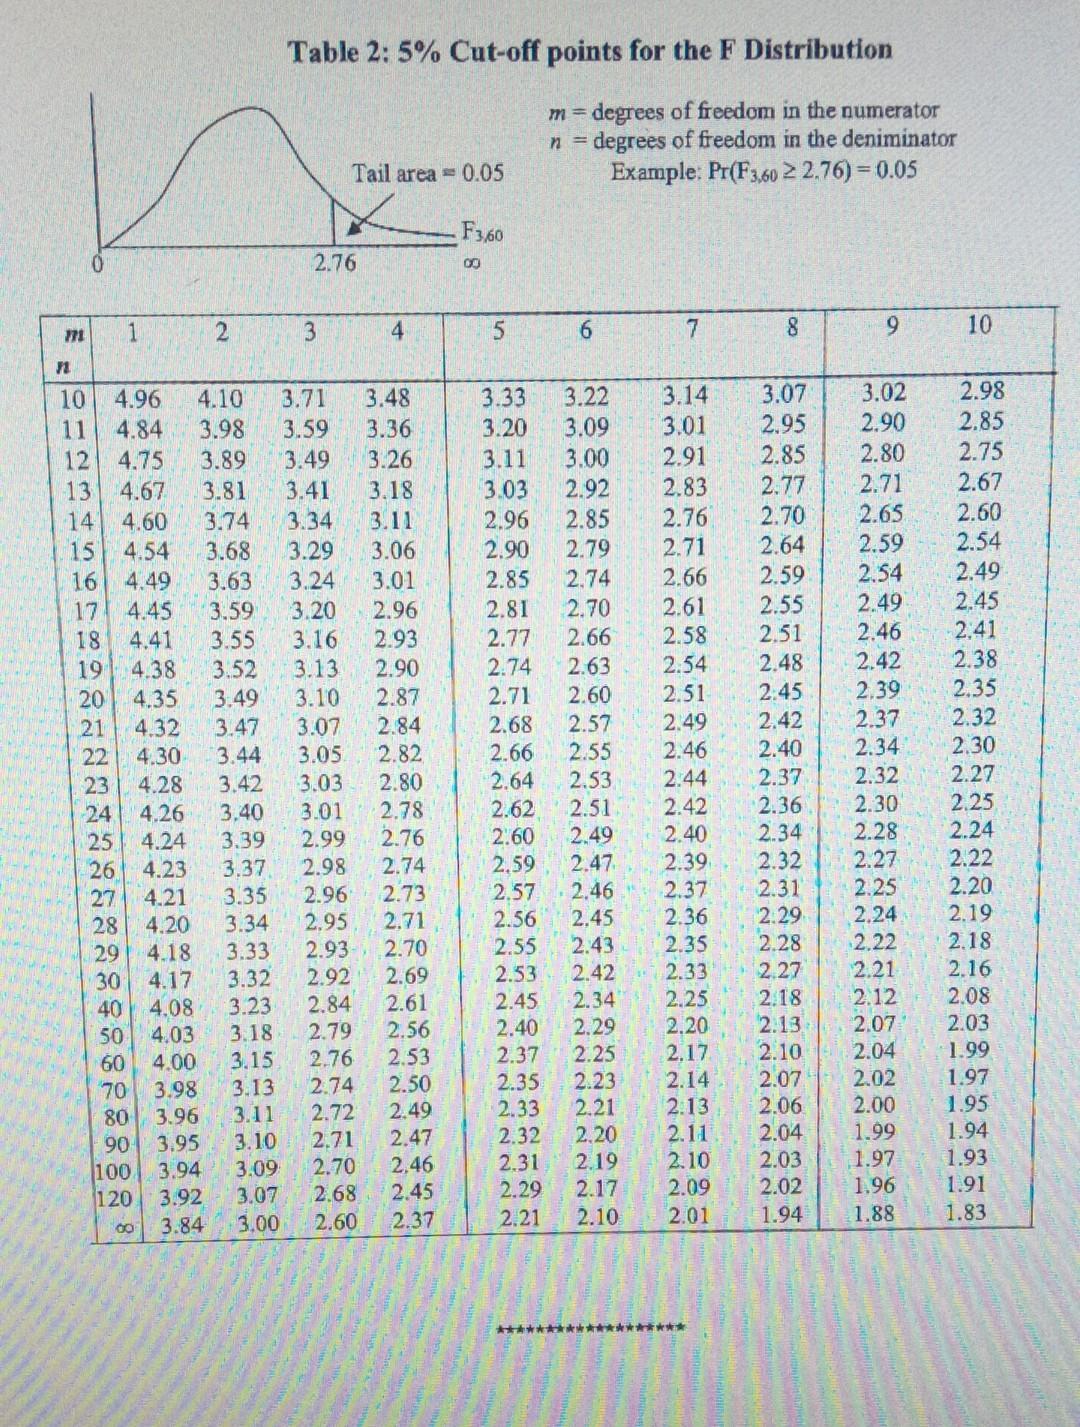
The crude birth rate (cbr) is defined as the ratio of the number of births in a year over the population in the mid-year, expressed per 1000 population. The infant mortality rate (mort) is defined as the ratio of the number of deaths of infants under the age of one in a year over the number of live births in that year, expressed per 1000 live births. Data on these variables for 125 countries in the year 1985 can be used to run these two simple regressions: cbr=B,+Bmort+ & or cbra,+a, log(mort) +u where & and u are the errors in the respective equations. (1) (2) (a) Mukherjee et al. (Econometrics and Data Analysis for Developing Countries, 1998, where these data can be found) state, "Under conditions of poverty and ill-health, where infant mortality is high, it is the expected number of surviving children - that is, children who survive into adulthood - which guides fertility decisions". According to this reasoning, what is the expected sign of , or a,? (2 marks) (b) Given the scatter plots of cbr on mort and log(mort) below, which of the linear regressions above is likely to offer a better fit to the data? Why? (2 marks) MD 50- 40- 50- 10- MORT 120 100 200 40- 30- 20 10- 20 24 28 32 38 40 44 48 82 LOG(MORT) (c) Using data for all countries, least squares estimation of the two regressions above generated the results below. Can we compare the R measures in these two regressions? Explain. (2 marks) Regression 1: Dependent Variable cbr Estimate Std. Error t-statistic p-value Intercept 16.04092 0.98127 16.35 <0.001 mort 0.24299 0.01173 20.71 <0.001 R-squared = 0.78 Regression 2: Dependent Variable cbr Estimate Std. Error t-statistic p-value Intercept -15.33838 1.83720 -8.35 <0.001 log(mort) 12.50974 0.46485 26.91 R-squared 0.85 (d) Interpret the estimated coefficient of mort (B2) in the first table (Regression 1) above. Construct a 95% confidence interval for B. What does the hypothesis H, B = 0 mean? Can you reject this hypothesis using the 95% confidence interval for B? Note that the confidence interval must be used for the (8 marks) test. What is the significance level of this test? (e) Given the t-statistic (26.91) for a, in the second table (Regression 2), what is the approximate p-value? Give your reason. Use this value to test the hypothesis that Ha, =0 against the alternative H, : a, >0 at the 1% level of significance. (4 marks) (f) Use the estimates in the second table (Regression 2) to predict the crude birth rate (cbr) (2 marks) for a country with an infant mortality rate (mort) of 66. 2.5% Table 1: Cut-off Points for Student's t Distribution 2.5% The row labels are the degrees of freedom. The two-tail column headings give the probability that will exceed the tabulated value c in absolute value, i.e. P ( c), e.g. forv 7, P(t 2.365) = 0.05. -2.365 0 2.365 10% 0 1.638 The one-tail column headings give the probability that will simply exceed the tabulated value, c.g. for v = 3, P(t > 1.638) = 0.10. One-tail probability-values 0.10 0.05 0.025 0.01 Two-tail probability-values 0.005 0.001 0.0005 v (df) 0.20 0.10 0.05 0.02 0.01 0.002 0.001 1 3.078 6.314 12.706 31.821 63.656 318.289 636.578 2 1.886 2.920 4.303 6.965 9.925 22.328 31.600 3 1.638 2.353 3.182 4.541 5.841 10.214 12.924 4 1.533 2.132 2.776 3.747 4.604 7.173 8.610 1.476 2.015 2.571 3.365 4.032 5.893 6.869 6 1.440 1.943 2.447 3.143 3.707 5.208 5.959 7 1.415 1.895 2.365 2.998 3.499 4.785 5.408 8 1.397 1.860 2.306 2.896 3.355 4.501 5.041 9 1.383 1.833 2.262 2.821 3.250 4.297 4.781 10 1.372 1.812 2.228 2.764 3.169 4.144 4.587 11 1.363 1.796 2.201 2.718 3.106 4.025 4.437 12 1.356 1.782 2.179 2.681 3.055 3.930 4.318 1.350 1.771 2.160 2.650 3.012 3.852 4.221 1.345 1.761 2.145 2.624 2.977 3.787 4.140 1.341 1.753 2:131 2.602 2.947 3.733 4.073 1.337 1.746 2.120 2.583 2.921 3.686 4.015 1.333 1.740 2.110 2.567 2.898 3.646 3.965 1.330 1.734 2.101 2.552 2.878 3.610 3.922 1.328 1.729 2.093 2.539 2.861 3.579 3.883 1.325 1.725 2.086 2.528 2.845 3.552 3.850 22222222224828 1.323 1.721 2.080 2.518 2.831 3.527 3.819 1.321 1.717 2.074 2.508 2.819 3.505 3.792 1.319 1.714 2.069 2.500 2.807 3.485 3.767 1.318 1.711 2.064 2.492 2.797 3.467 3.745 1.316 1.708 2.060 2.485 2.787 3.450 3.725 26 1.315 1.706 2.056 2.479 2.779 3.435 3.707 1.314 1.703 2.052 2.473 2.771 3.421 3.690 1.313 1.701 2.048 2.467 2.763 3.408 3.674 1.311 1.699 2.045 2.462 2.756 3.396 3.659 1.310 1.697 2.042 2.457 2.750 3.385 3.646 1.303 1.684 2.021 2.423 2.704 3.307 3.551 1.296 1.671 2.000 2.390 2.660 3.232 3.460 120 1.289 1.658 1.980 2.358 2.617 3.160 3.373 1.282 1.645 1.960 2.326 2.576 3.090 3.290 Table 2: 5% Cut-off points for the F Distribution 2.76 Tail area =0.05 F3,60 8 m=degrees of freedom in the numerator n = degrees of freedom in the deniminator Example: Pr(F3,60 2.76) = 0.05 771 1 2 3 4 5 9 7 8 9 10 72 10 4.96 4.10 3.71 3.48 3.33 3.22 3.14 3.07 3.02 2.98 11 4.84 3.98 3.59 3.36 3.20 3.09 3.01 2.95 2.90 2.85 12 4.75 3.89 3.49 3.26 3.11 3.00 2.91 2.85 2.80 2.75 13 4.67 3.81 3.41 3.18 3.03 2.92 2.83 2.77 2.71 2.67 14 4.60 3.74 3.34 3.11 2.96 2.85 2.76 2.70 2.65 2.60 15 4.54 3.68 3.29 3.06 2.90 2.79 2.71 2.64 2.59 2.54 16 4.49 3.63 3.24 3.01 2.85 2.74 2.66 2.59 2.54 2.49 17 4.45 3.59 3.20 2.96 2.81 2.70 2.61 2.55 2.49 2.45 18 4.41 3.55 3.16 2.93 2.77 2.66 2.58 2.51 2.46 2:41 19 4.38 3.52 20 4.35 3.49 3.10 3.13 2.90 2.74 2.63 2.54 2.48 2.42 2.38 2.87 2.71 2.60 2.51 2:45 2.39 2.35 21 4.32 3.47 3.07 2.84 2.68 2.57 2.49 2.42 2.37 2.32 22 4.30 3.44 3.05. 2.82 2.66 2.55 2.46 2.40 2.34 2.30 23 4.28 3.42 3.03 2.80 2.64 2.53 2.44 2.37 2.32 2.27 24 4.26 3.40 3.01 2.78 2.62 2.51 2.42 2.36 2.30 2.25 25 4.24 3.39 2.99 2.76 2.60 2.49 2.40 2.34 2.28 2.24 26 4.23 3.37. 2.98 2.74 2,59 2.47 2.39 2.32 2.27 2.22 27 4.21 3.35 2.96 2.73 2.57 2.46 2.37 2.31 2.25 2.20 28 4.20 3.34 2.95 2.71 2.56 2.45 2.36 2.29 2.24 2.19 29 4.18 3.33 2.93 2.70 2.55 2.43 2.35 2.28 2,22 2.18 30 4.17 3.32 2.92 2.69 2.53 2.42 2.33 2.27 2.21 2.16 40 4.08 3.23 2.84 2.61 2.45 2.34' 2.25 2.18 2.12 2.08 50 4.03 3.18 2.79 2.56 2.40 2.29 2.20 2.13 2.07 2.03 60 4.00 3.15 2.76 2.53 2.37 2.25 2.17 2.10 2.04 1.99 70 3.98 3.13 2.74 2.50 2.35 2.23 2.14 2.07 2.02 1.97 80 3.96 3.11 2.72 2.49 2.33 2.21 2.13 2.06 2.00 1.95 90 3.95 3.10 2.71 2.47 2.32 2.20 2.11 2.04 1.99 1.94 100 3.94 3.09 2.70 2,46 2.31 2.19 2.10 2.03 1.97 1.93 120 3.92 3.07 2.68 2.45 2.29 2.17 2.09 2.02 1.96 1.91 00 3.84 3.00 2.60 2.37 2.21 2.10 2.01 1.94 1.88 1.83 ****** The crude birth rate (cbr) is defined as the ratio of the number of births in a year over the population in the mid-year, expressed per 1000 population. The infant mortality rate (mort) is defined as the ratio of the number of deaths of infants under the age of one in a year over the number of live births in that year, expressed per 1000 live births. Data on these variables for 125 countries in the year 1985 can be used to run these two simple regressions: cbr=B,+Bmort+ & or cbra,+a, log(mort) +u where & and u are the errors in the respective equations. (1) (2) (a) Mukherjee et al. (Econometrics and Data Analysis for Developing Countries, 1998, where these data can be found) state, "Under conditions of poverty and ill-health, where infant mortality is high, it is the expected number of surviving children - that is, children who survive into adulthood - which guides fertility decisions". According to this reasoning, what is the expected sign of , or a,? (2 marks) (b) Given the scatter plots of cbr on mort and log(mort) below, which of the linear regressions above is likely to offer a better fit to the data? Why? (2 marks) MD 50- 40- 50- 10- MORT 120 100 200 40- 30- 20 10- 20 24 28 32 38 40 44 48 82 LOG(MORT) (c) Using data for all countries, least squares estimation of the two regressions above generated the results below. Can we compare the R measures in these two regressions? Explain. (2 marks) Regression 1: Dependent Variable cbr Estimate Std. Error t-statistic p-value Intercept 16.04092 0.98127 16.35 <0.001 mort 0.24299 0.01173 20.71 <0.001 R-squared = 0.78 Regression 2: Dependent Variable cbr Estimate Std. Error t-statistic p-value Intercept -15.33838 1.83720 -8.35 <0.001 log(mort) 12.50974 0.46485 26.91 R-squared 0.85 (d) Interpret the estimated coefficient of mort (B2) in the first table (Regression 1) above. Construct a 95% confidence interval for B. What does the hypothesis H, B = 0 mean? Can you reject this hypothesis using the 95% confidence interval for B? Note that the confidence interval must be used for the (8 marks) test. What is the significance level of this test? (e) Given the t-statistic (26.91) for a, in the second table (Regression 2), what is the approximate p-value? Give your reason. Use this value to test the hypothesis that Ha, =0 against the alternative H, : a, >0 at the 1% level of significance. (4 marks) (f) Use the estimates in the second table (Regression 2) to predict the crude birth rate (cbr) (2 marks) for a country with an infant mortality rate (mort) of 66. 2.5% Table 1: Cut-off Points for Student's t Distribution 2.5% The row labels are the degrees of freedom. The two-tail column headings give the probability that will exceed the tabulated value c in absolute value, i.e. P ( c), e.g. forv 7, P(t 2.365) = 0.05. -2.365 0 2.365 10% 0 1.638 The one-tail column headings give the probability that will simply exceed the tabulated value, c.g. for v = 3, P(t > 1.638) = 0.10. One-tail probability-values 0.10 0.05 0.025 0.01 Two-tail probability-values 0.005 0.001 0.0005 v (df) 0.20 0.10 0.05 0.02 0.01 0.002 0.001 1 3.078 6.314 12.706 31.821 63.656 318.289 636.578 2 1.886 2.920 4.303 6.965 9.925 22.328 31.600 3 1.638 2.353 3.182 4.541 5.841 10.214 12.924 4 1.533 2.132 2.776 3.747 4.604 7.173 8.610 1.476 2.015 2.571 3.365 4.032 5.893 6.869 6 1.440 1.943 2.447 3.143 3.707 5.208 5.959 7 1.415 1.895 2.365 2.998 3.499 4.785 5.408 8 1.397 1.860 2.306 2.896 3.355 4.501 5.041 9 1.383 1.833 2.262 2.821 3.250 4.297 4.781 10 1.372 1.812 2.228 2.764 3.169 4.144 4.587 11 1.363 1.796 2.201 2.718 3.106 4.025 4.437 12 1.356 1.782 2.179 2.681 3.055 3.930 4.318 1.350 1.771 2.160 2.650 3.012 3.852 4.221 1.345 1.761 2.145 2.624 2.977 3.787 4.140 1.341 1.753 2:131 2.602 2.947 3.733 4.073 1.337 1.746 2.120 2.583 2.921 3.686 4.015 1.333 1.740 2.110 2.567 2.898 3.646 3.965 1.330 1.734 2.101 2.552 2.878 3.610 3.922 1.328 1.729 2.093 2.539 2.861 3.579 3.883 1.325 1.725 2.086 2.528 2.845 3.552 3.850 22222222224828 1.323 1.721 2.080 2.518 2.831 3.527 3.819 1.321 1.717 2.074 2.508 2.819 3.505 3.792 1.319 1.714 2.069 2.500 2.807 3.485 3.767 1.318 1.711 2.064 2.492 2.797 3.467 3.745 1.316 1.708 2.060 2.485 2.787 3.450 3.725 26 1.315 1.706 2.056 2.479 2.779 3.435 3.707 1.314 1.703 2.052 2.473 2.771 3.421 3.690 1.313 1.701 2.048 2.467 2.763 3.408 3.674 1.311 1.699 2.045 2.462 2.756 3.396 3.659 1.310 1.697 2.042 2.457 2.750 3.385 3.646 1.303 1.684 2.021 2.423 2.704 3.307 3.551 1.296 1.671 2.000 2.390 2.660 3.232 3.460 120 1.289 1.658 1.980 2.358 2.617 3.160 3.373 1.282 1.645 1.960 2.326 2.576 3.090 3.290 Table 2: 5% Cut-off points for the F Distribution 2.76 Tail area =0.05 F3,60 8 m=degrees of freedom in the numerator n = degrees of freedom in the deniminator Example: Pr(F3,60 2.76) = 0.05 771 1 2 3 4 5 9 7 8 9 10 72 10 4.96 4.10 3.71 3.48 3.33 3.22 3.14 3.07 3.02 2.98 11 4.84 3.98 3.59 3.36 3.20 3.09 3.01 2.95 2.90 2.85 12 4.75 3.89 3.49 3.26 3.11 3.00 2.91 2.85 2.80 2.75 13 4.67 3.81 3.41 3.18 3.03 2.92 2.83 2.77 2.71 2.67 14 4.60 3.74 3.34 3.11 2.96 2.85 2.76 2.70 2.65 2.60 15 4.54 3.68 3.29 3.06 2.90 2.79 2.71 2.64 2.59 2.54 16 4.49 3.63 3.24 3.01 2.85 2.74 2.66 2.59 2.54 2.49 17 4.45 3.59 3.20 2.96 2.81 2.70 2.61 2.55 2.49 2.45 18 4.41 3.55 3.16 2.93 2.77 2.66 2.58 2.51 2.46 2:41 19 4.38 3.52 20 4.35 3.49 3.10 3.13 2.90 2.74 2.63 2.54 2.48 2.42 2.38 2.87 2.71 2.60 2.51 2:45 2.39 2.35 21 4.32 3.47 3.07 2.84 2.68 2.57 2.49 2.42 2.37 2.32 22 4.30 3.44 3.05. 2.82 2.66 2.55 2.46 2.40 2.34 2.30 23 4.28 3.42 3.03 2.80 2.64 2.53 2.44 2.37 2.32 2.27 24 4.26 3.40 3.01 2.78 2.62 2.51 2.42 2.36 2.30 2.25 25 4.24 3.39 2.99 2.76 2.60 2.49 2.40 2.34 2.28 2.24 26 4.23 3.37. 2.98 2.74 2,59 2.47 2.39 2.32 2.27 2.22 27 4.21 3.35 2.96 2.73 2.57 2.46 2.37 2.31 2.25 2.20 28 4.20 3.34 2.95 2.71 2.56 2.45 2.36 2.29 2.24 2.19 29 4.18 3.33 2.93 2.70 2.55 2.43 2.35 2.28 2,22 2.18 30 4.17 3.32 2.92 2.69 2.53 2.42 2.33 2.27 2.21 2.16 40 4.08 3.23 2.84 2.61 2.45 2.34' 2.25 2.18 2.12 2.08 50 4.03 3.18 2.79 2.56 2.40 2.29 2.20 2.13 2.07 2.03 60 4.00 3.15 2.76 2.53 2.37 2.25 2.17 2.10 2.04 1.99 70 3.98 3.13 2.74 2.50 2.35 2.23 2.14 2.07 2.02 1.97 80 3.96 3.11 2.72 2.49 2.33 2.21 2.13 2.06 2.00 1.95 90 3.95 3.10 2.71 2.47 2.32 2.20 2.11 2.04 1.99 1.94 100 3.94 3.09 2.70 2,46 2.31 2.19 2.10 2.03 1.97 1.93 120 3.92 3.07 2.68 2.45 2.29 2.17 2.09 2.02 1.96 1.91 00 3.84 3.00 2.60 2.37 2.21 2.10 2.01 1.94 1.88 1.83 ******
Expert Answer:

Related Book For 

Statistics The Art And Science Of Learning From Data
ISBN: 9780321755940
3rd Edition
Authors: Alan Agresti, Christine A. Franklin
Posted Date:
Students also viewed these mathematics questions
-
CANMNMM January of this year. (a) Each item will be held in a record. Describe all the data structures that must refer to these records to implement the required functionality. Describe all the...
-
QUIZ... Let D be a poset and let f : D D be a monotone function. (i) Give the definition of the least pre-fixed point, fix (f), of f. Show that fix (f) is a fixed point of f. [5 marks] (ii) Show that...
-
Researchers Dumas and Dunbar wanted to see whether stereotypes related to creativity can influence a subjects creativity. The 96 subjects were randomly placed into three groups of 32 each. One group...
-
Show that if Re z1 > 0 and Re z2 > 0, then Log(z1z2) = Log z1 + Log z2.
-
Fill in each blank so that the resulting statement is true. If the center of an ellipse is (3, -2), the major axis is horizontal and parallel to the x-axis, and the distance from the center of the...
-
1. Working in small groups, complete the Pay Raise Worksheet. 2. After the class reconvenes, group spokespersons present group findings. Pay Raise Worksheet April Knepper is the new supervisor of an...
-
Lame Specialties manufactures, among other things, woolen blankets for the athletic teams of the two local high schools. The company sews the blankets from fabric and sews on a logo patch purchased...
-
Question 2 Consider a monopsonist with the following relationship between wage and labor: and the following production function w= a+bL f(K, L) = ln(L) + In(K) (3) (4) 1. Write the short run profit...
-
(c) Phang Berhad (Phang) specializes in manufacturing electrical goods and has three factories and three distribution depots spread across Malaysia. The company has a diverse customer base, but it...
-
Enumerate three distinct stakeholder cohorts impacted by the unethical behavior exhibited by Enron's leadership. Subsequently, analyze the ramifications experienced by each group as a result of this...
-
Determine whether f(x)=-5x^(2)-10x+6 has a maximum or a minimum value. Find that value and explain how you know.
-
Does the Hershey's Company have or have access to the resources needed to fill in the gaps? After reading the article: Teaching SWOT, it could be said that Hersheys company is currently in the...
-
How much would you be willing to pay today for an annuity that promises to pay $9,554 per year for 19 years, beginning exactly one year from today. Your relevant interest rate is 9 percent.
-
Do any words need to be italicized in the following reference to follow APA 7th edition guidelines? Woodbury, MN | Data USA. (n.d.). Data USA.
-
You just had terry, one of your team members from marketing, give a presentation to the engineering group about the new product and its importance to the companys product line. The presentation...
-
Banner Company acquires an 80% interest in Roller Company for $640,000 cash on January 1, 2013. The NCI has a fair value of $160,000. Any excess of cost over book value is attributed to goodwill. To...
-
A diffraction grating is a closely spaced array of apertures or obstacles forming a series of closely spaced slits. The simplest type in which an incoming wave front meets alternating opaque and...
-
Find the position of the first minimum for a single slit of width 0.04 \(\mathrm{mm}\) on a screen of \(2 \mathrm{~m}\) distance, when light from a He-Ne laser \(\lambda=\) 6328 is shone on the slit.
-
A GaAs p-n junction has a \(100 \mu \mathrm{m} \times 100 \mathrm{~m}\) cross section and a width of the depletion layer \(W=440 \mathrm{~nm}\). Consider the junction in thermal equilibrium without...

Study smarter with the SolutionInn App