

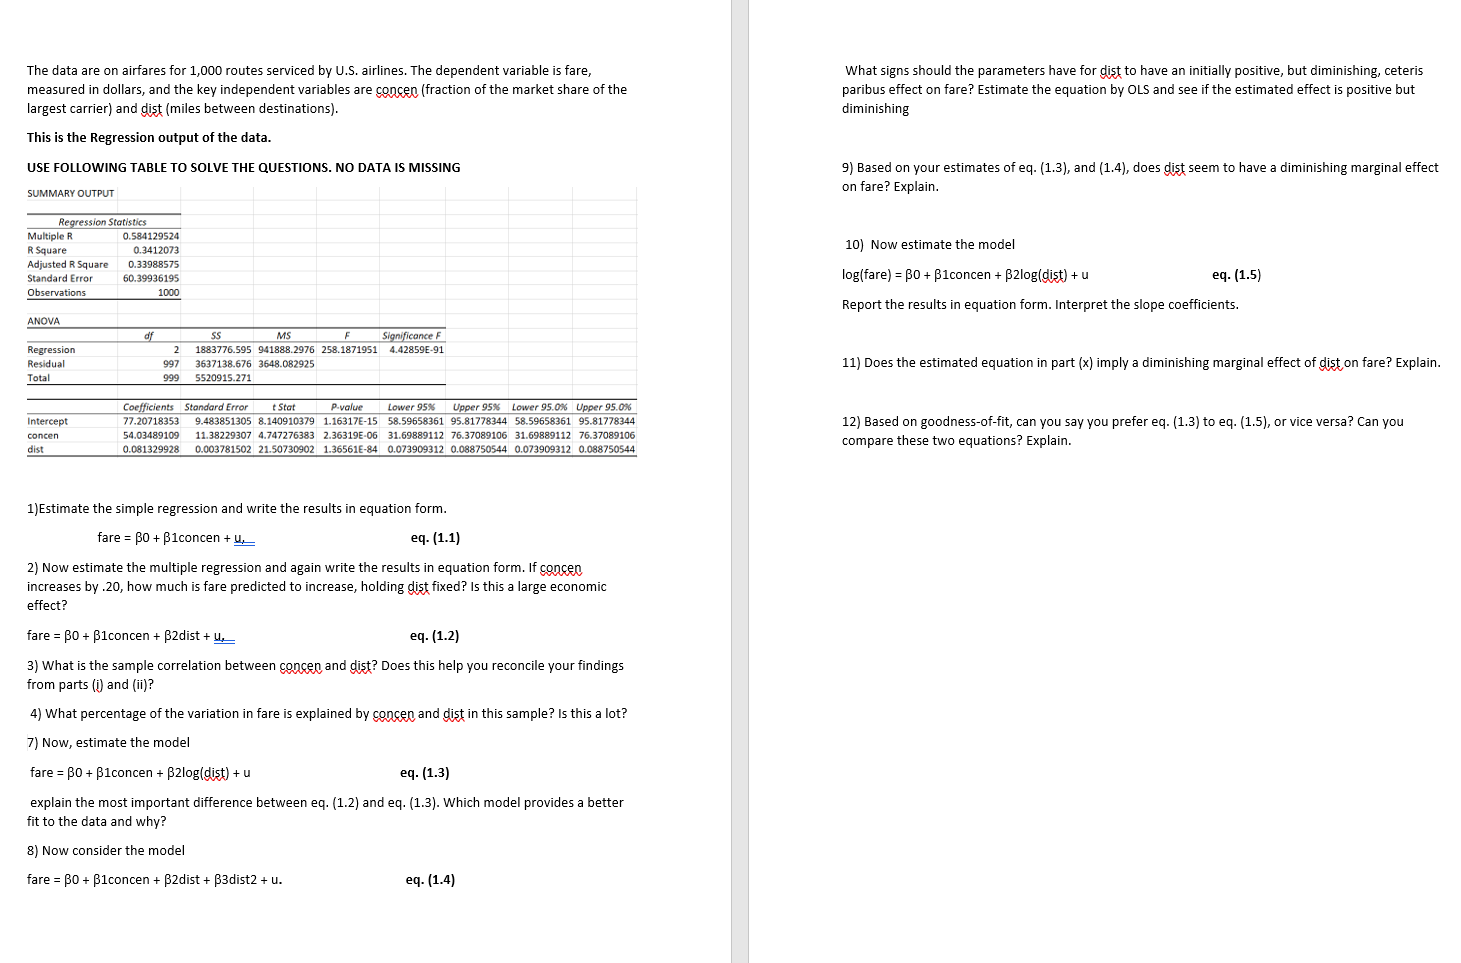
The data are on airfares for 1,000 routes serviced by U.S. airlines. The dependent variable is...
Fantastic news! We've Found the answer you've been seeking!
Question:
Transcribed Image Text:
The data are on airfares for 1,000 routes serviced by U.S. airlines. The dependent variable is fare, measured in dollars, and the key independent variables are concen (fraction of the market share of the largest carrier) and dist (miles between destinations). This is the Regression output of the data. USE FOLLOWING TABLE TO SOLVE THE QUESTIONS. NO DATA IS MISSING SUMMARY OUTPUT Regression Statistics Multiple R 0.584129524 What signs should the parameters have for dist to have an initially positive, but diminishing, ceteris paribus effect on fare? Estimate the equation by OLS and see if the estimated effect is positive but diminishing 9) Based on your estimates of eq. (1.3), and (1.4), does dist seem to have a diminishing marginal effect on fare? Explain. R Square Adjusted R Square Standard Error 0.3412073 0.33988575 60.39936195 Observations 1000 ANOVA df Regression Residual Total 2 997 999 SS MS 1883776.595 941888.2976 258.1871951 3637138.676 3648.082925 5520915.271 F Significance F 4.42859E-91 Intercept 77.20718353 Coefficients Standard Error t Stat P-value Lower 95% Upper 95% Lower 95.0% Upper 95.0% 9.483851305 8.140910379 1.16317E-15 58.59658361 95.81778344 58.59658361 95.81778344 concen dist 54.03489109 11.38229307 4.747276383 2.36319E-06 31.69889112 76.37089106 31.69889112 76.37089106 0.081329928 0.003781502 21.50730902 1.36561E-84 0.073909312 0.088750544 0.073909312 0.088750544 1)Estimate the simple regression and write the results in equation form. fare 0+ 1concen+ eq. (1.1) 2) Now estimate the multiple regression and again write the results in equation form. If concen increases by .20, how much is fare predicted to increase, holding dist fixed? Is this a large economic effect? fare = 0 + 1concen + 2dist + eq. (1.2) 3) What is the sample correlation between concen and dist? Does this help you reconcile your findings from parts (i) and (ii)? 4) What percentage of the variation in fare is explained by concen and dist in this sample? Is this a lot? 7) Now, estimate the model fare 30+ iconcen + 2log(dist) + u eq. (1.3) explain the most important difference between eq. (1.2) and eq. (1.3). Which model provides a better fit to the data and why? 8) Now consider the model fare = 0 + 1concen + 2dist + 3dist2 + u. eq. (1.4) 10) Now estimate the model log(fare) 0+1concen + 2log(dist) + u eq. (1.5) Report the results in equation form. Interpret the slope coefficients. 11) Does the estimated equation in part (x) imply a diminishing marginal effect of dist on fare? Explain. 12) Based on goodness-of-fit, can you say you prefer eq. (1.3) to eq. (1.5), or vice versa? Can you compare these two equations? Explain. The data are on airfares for 1,000 routes serviced by U.S. airlines. The dependent variable is fare, measured in dollars, and the key independent variables are concen (fraction of the market share of the largest carrier) and dist (miles between destinations). This is the Regression output of the data. USE FOLLOWING TABLE TO SOLVE THE QUESTIONS. NO DATA IS MISSING SUMMARY OUTPUT Regression Statistics Multiple R 0.584129524 What signs should the parameters have for dist to have an initially positive, but diminishing, ceteris paribus effect on fare? Estimate the equation by OLS and see if the estimated effect is positive but diminishing 9) Based on your estimates of eq. (1.3), and (1.4), does dist seem to have a diminishing marginal effect on fare? Explain. R Square Adjusted R Square Standard Error 0.3412073 0.33988575 60.39936195 Observations 1000 ANOVA df Regression Residual Total 2 997 999 SS MS 1883776.595 941888.2976 258.1871951 3637138.676 3648.082925 5520915.271 F Significance F 4.42859E-91 Intercept 77.20718353 Coefficients Standard Error t Stat P-value Lower 95% Upper 95% Lower 95.0% Upper 95.0% 9.483851305 8.140910379 1.16317E-15 58.59658361 95.81778344 58.59658361 95.81778344 concen dist 54.03489109 11.38229307 4.747276383 2.36319E-06 31.69889112 76.37089106 31.69889112 76.37089106 0.081329928 0.003781502 21.50730902 1.36561E-84 0.073909312 0.088750544 0.073909312 0.088750544 1)Estimate the simple regression and write the results in equation form. fare 0+ 1concen+ eq. (1.1) 2) Now estimate the multiple regression and again write the results in equation form. If concen increases by .20, how much is fare predicted to increase, holding dist fixed? Is this a large economic effect? fare = 0 + 1concen + 2dist + eq. (1.2) 3) What is the sample correlation between concen and dist? Does this help you reconcile your findings from parts (i) and (ii)? 4) What percentage of the variation in fare is explained by concen and dist in this sample? Is this a lot? 7) Now, estimate the model fare 30+ iconcen + 2log(dist) + u eq. (1.3) explain the most important difference between eq. (1.2) and eq. (1.3). Which model provides a better fit to the data and why? 8) Now consider the model fare = 0 + 1concen + 2dist + 3dist2 + u. eq. (1.4) 10) Now estimate the model log(fare) 0+1concen + 2log(dist) + u eq. (1.5) Report the results in equation form. Interpret the slope coefficients. 11) Does the estimated equation in part (x) imply a diminishing marginal effect of dist on fare? Explain. 12) Based on goodness-of-fit, can you say you prefer eq. (1.3) to eq. (1.5), or vice versa? Can you compare these two equations? Explain.
Expert Answer:

Related Book For 

Posted Date:
Students also viewed these mathematics questions
-
Target profit analysis is used to calculate the sales volume that is needed to Question 19 options: Cover all expenses Earn a specific amount of net operating income Cover all fixed expenses
-
Use the data in ELEM94_95 to answer this question. The data are on elementary schools in Michigan. In this exercise, we view the data as a cluster sample, where each school is part of a district...
-
Jacks Tracks sells 24,000 custom-designed GoKarts per year. These GoKarts are sold evenly throughout the year. The manufacturer charges Jack a $50 processing cost per order, and Jack incurs a...
-
According to Catalyst, based on a survey of Fortune 500 companies, 14% of Executive Officer positions in 2012 were female. Answer the following questions based on a random sample of 12 corporate...
-
Explain the difference between a weak and a strong entity set.
-
Hardesty Company uses budgets in controlling costs. The May 2010 budget report for the company's Packaging Department is as follows. The monthly budget amounts in the report were based on an expected...
-
Unqualified Audit Report. Following is the unqualified audit report for the City of Sand Key. The Honorable Mayor Members of the City Commission and City Manager City of Sand Key We have audited the...
-
Friends-1.txt file contains: Anne Xie Juan Mohammed Shireen Liliana Marcelo Derek Chris Tonya Salman Q1) Here is the erroneous program. Denote the area where the errors occur. Explain the errors and...
-
You are a Financial Planner (FP) and received a survey comment that said "I haven't heard from her since I signed up 6 months ago." What do you take from this? Determine who the client is and look to...
-
How can interdisciplinary research at the intersection of psychology, sociology, and ecology deepen our comprehension of resilience as a multi-dimensional construct ?
-
Meir, Benson, and Lau are partners and share income and loss in a 2:3:5 ratio (in percents: Meir, 20%; Benson, 30%; and Lau, 50%). The partnership's capital balances are as follows: Meir, $74,000;...
-
Castner Corporation is considering implementation of a JIT inventory system. The company's industrial engineer recently conducted a study to determine the average number of days spent in each...
-
A general expression of a vector field B is given by the expression B = 4xy 4yj + 4yzk and exists in the surface S shown below where a = 3.0 and d = 4.0 and the surface is parallel to the xz-plane....
-
A given polyhedron is the Feasible Region of a linear programming problem inside, and the indicating variable on each side is as follows. a) Reveal both basic and non-basic variables at point A b)...
-
Out of a sample of 100 juice bottles, 95 bottles contain between 1,476 and 1,524 mililiters of juice. Use the empirical rule to estimate the following: a. Average quantity in the juice bottles: mL b....
-
a) Show that (a, b) := {{a}, {b}} does not satisfy the ordered pair axiom. b) Determine whether each of the following statements is true or false. (Give a reason in each case): (i) {a, b} C (a, b)....
-
The directors of Woebun Standard Components plc have been very successful in persuading their customers to pay, on average, in one month. However, they believe that this policy is restricting sales...
-
The Bonjarron Decorating Company uses 14,400 large-size cans of white gloss paint in a year. It uses different suppliers and on average pays 20 per can. It has limited storage space and reckons that...
-
Many small businesses may be seen as overtrading. Accountants are too conservative about such things. To be successful, a rapidly expanding small business needs to sail close to the wind. Discuss...

Study smarter with the SolutionInn App