

The data in the following table reflect the amount of time 40 students in a section of
Fantastic news! We've Found the answer you've been seeking!
Question:
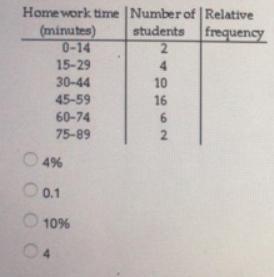
The data in the following table reflect the amount of time 40 students in a section of Statistics 101 spend on homework each day. Determine the value that should be entered in the relative frequency column for the class 15-29.
Expert Answer:

Related Book For 

Applied Regression Analysis and Other Multivariable Methods
ISBN: 978-1285051086
5th edition
Authors: David G. Kleinbaum, Lawrence L. Kupper, Azhar Nizam, Eli S. Rosenberg
Posted Date:
