

The Department of Health of a certain state estimates a 10% rate of HIV for the...
Fantastic news! We've Found the answer you've been seeking!
Question:
Transcribed Image Text:
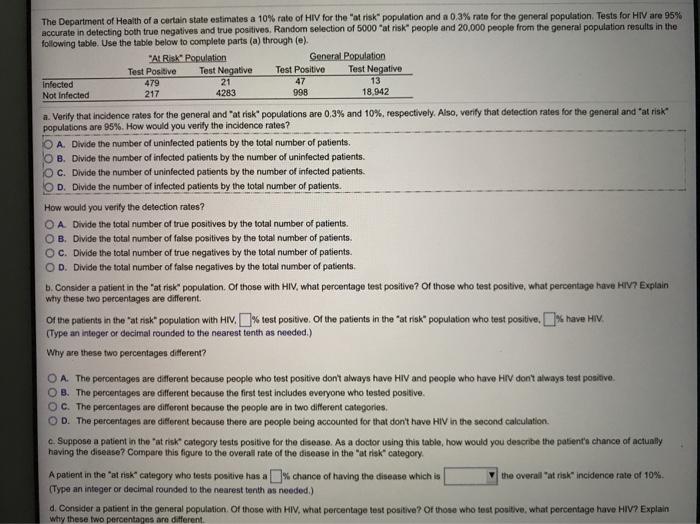
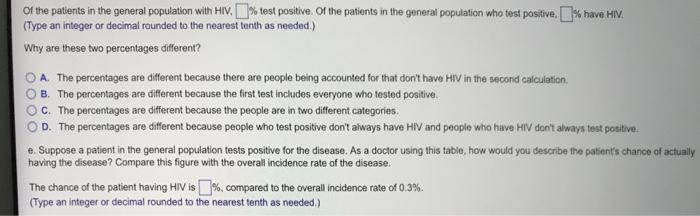
The Department of Health of a certain state estimates a 10% rate of HIV for the "at risk" population and a 0.3% rate for the general population. Tests for HIV are 95% accurate in detecting both true negatives and true positives. Random selection of 5000 "at risk" people and 20,000 people from the general population results in the following table. Use the table below to complete parts (a) through (e). "AL Risk Population Test Positive 479 217 Test Negative 21 4283 General Population Test Negative 13 18.942 Test Positive Infected Not Infected 47 998 a. Verify that incidence rates for the general and "at risk" populations are 0,3% and 10%, respectively. Also, verify that detection rates for the general and "at risk populations are 95%. How would you verify the incidence rates? A. Divide the number of uninfected patients by the total number of patients. O B. Divide the number of infected patients by the number of uninfected patients. OC. Divide the number of uninfected patients by the number of infected patients. O D. Divide the number of infected patients by the total number of patlents. How would you verify the detection rates? OA Divide the total number of true positives by the total number of patients. OB. Divide the total number of false positives by the total number of patients. OC. Divide the total number of true negatives by the total number of patients. O D. Divide the total number of false negatives by the total number of patients. b. Consider a patient in the "at risk" population. Or those with HIV, what percentage test positive? Of those who test positive, what percentage have HIV? Explain why these two percentages are different. Of the patients in the "at rak population with HIV. % test positive. Of the patients in the "at risk" population who test posive, k have HIV. (Type an integer or decimal rounded to the nearest tenth as needed.) Why are these two percentages different? OA. The percentages are different because people who test positive don't always have HIV and people who have HIV don't always test positive. OB. The percentages are different because the first test includes everyone who tested positive. OC. The percentages are different because the people are in two different categories, O D. The percentages are different because there are people being accounted for that don't have HIV in the second calculation. c. Suppose a patient in the "at risk" category tests positive for the disease. As a doctor using this table, how would you describe the patient's chance of actunly having the disease? Compare this figure to the overall rate of the disease in the "at risk" category. A patient in the "at risk" category who tests positive has a% chance of having the disease which is (Type an integer or decimal rounded to the nearest tenth as needed.) the overall "at risk" incidence rate of 10%. d. Consider a patient in the general population. Of those with HIV, what percentage test positive? Of those who test positive, what percentage have HIV? Explain why these two percentages are different. Of the patients in the general population with HIV. % test positive. Of the patients in the general population who test positive, % have HIV. (Type an integer or decimal rounded to the nearest tenth as needed.) Why are these two percentages different? O A. The percentages are different because there are people being accounted for that don't have HIV in the second calculation. O B. The percentages are different because the first test includes everyone who tested positive. C. The percentages are different because the people are in two different categories. D. The percentages are different because people who test positive dont always have HIV and people who have HIV don't always test positive. e. Suppose a patient in the general population tests positive for the disease. As a doctor using this table, how would you describe the patient's chance of actually having the disease? Compare this figure with the overall incidence rate of the disease. The chance of the patient having HIV is %. compared to the overall incidence rate of 0.3%. (Type an integer or decimal rounded to the nearest tenth as needed.) The Department of Health of a certain state estimates a 10% rate of HIV for the "at risk" population and a 0.3% rate for the general population. Tests for HIV are 95% accurate in detecting both true negatives and true positives. Random selection of 5000 "at risk" people and 20,000 people from the general population results in the following table. Use the table below to complete parts (a) through (e). "AL Risk Population Test Positive 479 217 Test Negative 21 4283 General Population Test Negative 13 18.942 Test Positive Infected Not Infected 47 998 a. Verify that incidence rates for the general and "at risk" populations are 0,3% and 10%, respectively. Also, verify that detection rates for the general and "at risk populations are 95%. How would you verify the incidence rates? A. Divide the number of uninfected patients by the total number of patients. O B. Divide the number of infected patients by the number of uninfected patients. OC. Divide the number of uninfected patients by the number of infected patients. O D. Divide the number of infected patients by the total number of patlents. How would you verify the detection rates? OA Divide the total number of true positives by the total number of patients. OB. Divide the total number of false positives by the total number of patients. OC. Divide the total number of true negatives by the total number of patients. O D. Divide the total number of false negatives by the total number of patients. b. Consider a patient in the "at risk" population. Or those with HIV, what percentage test positive? Of those who test positive, what percentage have HIV? Explain why these two percentages are different. Of the patients in the "at rak population with HIV. % test positive. Of the patients in the "at risk" population who test posive, k have HIV. (Type an integer or decimal rounded to the nearest tenth as needed.) Why are these two percentages different? OA. The percentages are different because people who test positive don't always have HIV and people who have HIV don't always test positive. OB. The percentages are different because the first test includes everyone who tested positive. OC. The percentages are different because the people are in two different categories, O D. The percentages are different because there are people being accounted for that don't have HIV in the second calculation. c. Suppose a patient in the "at risk" category tests positive for the disease. As a doctor using this table, how would you describe the patient's chance of actunly having the disease? Compare this figure to the overall rate of the disease in the "at risk" category. A patient in the "at risk" category who tests positive has a% chance of having the disease which is (Type an integer or decimal rounded to the nearest tenth as needed.) the overall "at risk" incidence rate of 10%. d. Consider a patient in the general population. Of those with HIV, what percentage test positive? Of those who test positive, what percentage have HIV? Explain why these two percentages are different. Of the patients in the general population with HIV. % test positive. Of the patients in the general population who test positive, % have HIV. (Type an integer or decimal rounded to the nearest tenth as needed.) Why are these two percentages different? O A. The percentages are different because there are people being accounted for that don't have HIV in the second calculation. O B. The percentages are different because the first test includes everyone who tested positive. C. The percentages are different because the people are in two different categories. D. The percentages are different because people who test positive dont always have HIV and people who have HIV don't always test positive. e. Suppose a patient in the general population tests positive for the disease. As a doctor using this table, how would you describe the patient's chance of actually having the disease? Compare this figure with the overall incidence rate of the disease. The chance of the patient having HIV is %. compared to the overall incidence rate of 0.3%. (Type an integer or decimal rounded to the nearest tenth as needed.)
Expert Answer:
Answer rating: 100% (QA)
a D Divide the number of infected patients by the total number ... View the full answer

Related Book For 

Probability & Statistics for Engineers & Scientists
ISBN: 978-0130415295
7th Edition
Authors: Ronald E. Walpole, Raymond H. Myers, Sharon L. Myers, Keying
Posted Date:
Students also viewed these accounting questions
-
In a study conducted by the Department of Health and Physical Education at the Virginia Polytechnic Institute and State University, 3 diets were assigned for a period of 3 days to each of 6 subjects...
-
The Department of Health and Human Services has proposed new guidelines for the interpretation of federal statutes on gifts, incentives, and other benefits bestowed on physicians by pharmaceutical...
-
The Department of Health and Human Services wants to know the average income of general assistance recipients. A sample of 60 recipients shows a sample mean of $ 17,400 with a standard deviation of $...
-
- You have identified several risks on your project for which purchasing insurance is a possibility. The insurance company your firm uses has quoted reasonable rates, and your analysis shows that...
-
What determines the amount of output an economy produces?
-
The electric potential difference between the ground and a cloud in a particular thunderstorm is 1.2 x 10⁹ V. In the unit electron-volts, what is the magnitude of the change in the electric potential...
-
In a transactional data, what is the effect of aggregating similar items into a broader product category? a. Item granularity does not matter as one can simply adjust the minimum support threshold....
-
Kiram Corporation purchased machinery on January 1, 2012, at a cost of $350,000. The estimated useful life of the machinery is 5 years, with an estimated salvage value at the end of that period of...
-
Discuss a competency for a position, and describe some of the indicators used to determine if the competency is present. There should be five indicators.
-
Lyndons employer withheld $8,700 in state income taxes from Lyndons wages in 2022. Lyndon obtained a refund of $1,700 this year for overpayment of state income taxes for 2021. State income taxes were...
-
A company is considering Projects X and Y with following information: Which project will you recommend and why?(A) Project Y as its higher expected NPV.(B) Project X as its coefficient of variation...
-
Founders Tech Inc. Accounts Receivable had a 2016 ending balance of $350,000 and a 2017 ending balance of $400,000. Credit sales for 2017 totaled $150,000. The company had 2016 ending balance in the...
-
Seacrest Corporation sells sailboats and has an inventory turnover ratio of 2.45 times per year based on its most recent audited annual financial statements. Assume a 365 day year. During the year...
-
Jamar and Natasha had the following income and expenses during the year: $45,000 in wages. $24,000 in rental income. $8,000 in rental expenses. $48,000 in self-employment receipts. $12,000 in...
-
Marlow Co. started a new business on October 1, 2021. That same day, Marlow Co. also received $400,000 of cash from issuing common stock and borrowed $190,000 from a friend. On October 1, 2021 Marlow...
-
The monthly fixed costs of a mini motel are $32000. The price per night for the coming year is set at $115. The costs that arise from rentals per day as the base-unit are $15 for maid service, $7 for...
-
Describe Conversation to For Profit Status. Why would a hospital undergo the conversion?
-
In Exercises 1558, find each product. (9 - 5x) 2
-
In an article Shelf-Space Strategy in Retailing, published in the Proceedings: Southern Marketing Association, the effect of shelf height on the supermarket sales of canned dog food is investigated....
-
Referring to Exercise 4.35 find the mean and variance of the discrete random variable Z = 3X 2, when X represents the number of errors per 100 lines of code.
-
Consider the aggregate data of Example 13.1. Perform Bartlett's test to determine if there is heterogeneity of variance among the aggregates,
-
Describe what sexual harassment is and what forms it can take.
-
Explain public policies that protect employees from unlawful discharge.
-
Discuss under what conditions unemployment compensation can be denied to a claimant.

Study smarter with the SolutionInn App