

The figure (Figure 1) shows voltage and current graphs for a resistor. f=25 Hz, R=20 amps Draw
Fantastic news! We've Found the answer you've been seeking!
Question:
The figure (Figure 1) shows voltage and current graphs for a resistor.
f=25 Hz, R=20 amps
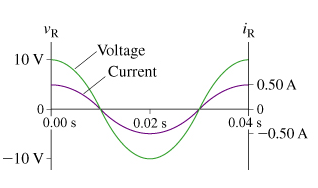
Draw the resistor?s voltage and current phasors at t=15ms.
Draw the vectors with their tails at the origin. The orientation of your vectors will be graded. The exact length of your vectors will not be graded.

Expert Answer:

Related Book For 

Physics for Scientists and Engineers A Strategic Approach with Modern Physics
ISBN: 978-0133942651
4th edition
Authors: Randall D. Knight
Posted Date:
