

The figure on page 3 shows data from a 5 year hypothetical prospective cohort study. Each...
Fantastic news! We've Found the answer you've been seeking!
Question:
Transcribed Image Text:
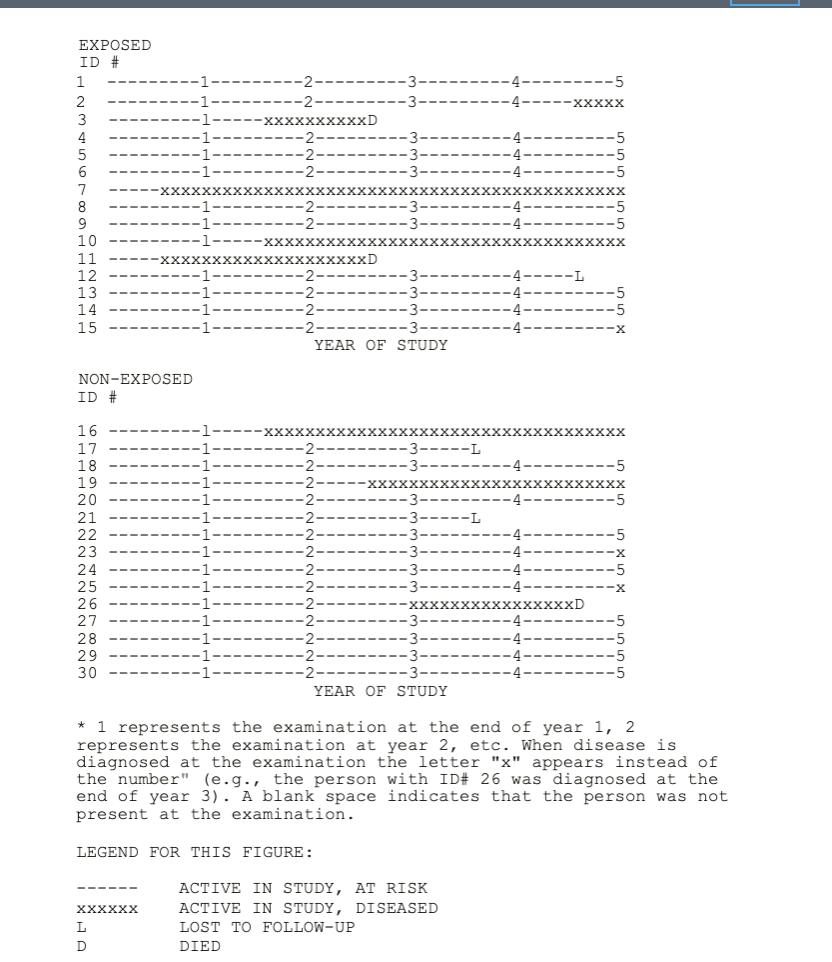
The figure on page 3 shows data from a 5 year hypothetical prospective cohort study. Each line summarizes the experience of a person in the study; the exposure was present for 15 individuals (ID numbers 1-15) and the other 15 people were non- exposed (ID# 16-30). All individuals were free of the disease at baseline, and incident cases of disease were diagnosed at mid- year or at examinations conducted at the end of each year. Answer the following questions using the data displayed in the figure. 1 Based on the data from the first two years of the study, answer the following questions. 1a. Compute and interpret the cumulative incidence of disease separately for the exposed and the non-exposed for the first 2 years of the study (i.e. years 1 and 2 combined). (4 points for calculation and 2 points for interpretation) 1b. Compute the incidence odds (odds of cumulative incidence ) for each exposure group for the first 2 years in the study. Is the incidence odds a good estimate of the cumulative incidence computed in la? (4 points for calculation and 2 points for interpretation) 1c. Compute and interpret the prevalence of disease for each exposure group at the examination at the end of year 2. Briefly discuss why the prevalence measures are similar or different to the incidence measures in la. (4 points for calculation and 2 points for interpretation, 2 points for discussion) 1d. Compute and interpret the incidence rate (density) for each exposure group using the first 2 years of data. (4 points for calculation and 2 points for interpretation) 2. Compute cumulative incidence and incidence rate (density) of disease for each exposure group using the first 3 years of data. Compute the prevalence of disease for each exposure group at the examination at the end of year 3. Briefly discuss the comparison of cumulative incidence and prevalence (as in 1c). (12 points for calculation, 2 points for discussion) 3. Compute cumulative incidence and incidence rate (density) of disease for each exposure group using the first 4 years of data. Compute the prevalence of disease for each exposure group at the examination at the end of year 4. Describe how loss to follow-up affects each of these measures. (12 points for calculation, 2 points for discussion) 4. Compute the incidence rate (density) for each exposure group using all five years of data. (4 points for calculation) 5. Describe the differences between cumulative incidence and incidence rate (density) with respect to their (1) units, (2) ranges, and (3) characteristics of populations for which these measures are appropriate for. (3 points) EXPOSED ID # 2 3 4 6 7 8 9 10 11 12 13 14 15 NON-EXPOSED ID # 16 17 18 19 20 21 22 23 24 25 26 27 28 29 30 XXXXXX XXXXXXXXXXD L D XXXXXXXXXD YEAR OF STUDY YEAR OF STUDY 4- ACTIVE IN STUDY, AT RISK ACTIVE IN STUDY, DISEASED LOST TO FOLLOW-UP DIED XXXXX XXXXXX * 1 represents the examination at the end of year 1, 2 represents the examination at year 2, etc. When disease is diagnosed at the examination the letter "x" appears instead of the number" (e.g., the person with ID# 26 was diagnosed at the end of year 3). A blank space indicates that the person was not present at the examination. LEGEND FOR THIS FIGURE: xxxxD -5 XXX The figure on page 3 shows data from a 5 year hypothetical prospective cohort study. Each line summarizes the experience of a person in the study; the exposure was present for 15 individuals (ID numbers 1-15) and the other 15 people were non- exposed (ID# 16-30). All individuals were free of the disease at baseline, and incident cases of disease were diagnosed at mid- year or at examinations conducted at the end of each year. Answer the following questions using the data displayed in the figure. 1 Based on the data from the first two years of the study, answer the following questions. 1a. Compute and interpret the cumulative incidence of disease separately for the exposed and the non-exposed for the first 2 years of the study (i.e. years 1 and 2 combined). (4 points for calculation and 2 points for interpretation) 1b. Compute the incidence odds (odds of cumulative incidence ) for each exposure group for the first 2 years in the study. Is the incidence odds a good estimate of the cumulative incidence computed in la? (4 points for calculation and 2 points for interpretation) 1c. Compute and interpret the prevalence of disease for each exposure group at the examination at the end of year 2. Briefly discuss why the prevalence measures are similar or different to the incidence measures in la. (4 points for calculation and 2 points for interpretation, 2 points for discussion) 1d. Compute and interpret the incidence rate (density) for each exposure group using the first 2 years of data. (4 points for calculation and 2 points for interpretation) 2. Compute cumulative incidence and incidence rate (density) of disease for each exposure group using the first 3 years of data. Compute the prevalence of disease for each exposure group at the examination at the end of year 3. Briefly discuss the comparison of cumulative incidence and prevalence (as in 1c). (12 points for calculation, 2 points for discussion) 3. Compute cumulative incidence and incidence rate (density) of disease for each exposure group using the first 4 years of data. Compute the prevalence of disease for each exposure group at the examination at the end of year 4. Describe how loss to follow-up affects each of these measures. (12 points for calculation, 2 points for discussion) 4. Compute the incidence rate (density) for each exposure group using all five years of data. (4 points for calculation) 5. Describe the differences between cumulative incidence and incidence rate (density) with respect to their (1) units, (2) ranges, and (3) characteristics of populations for which these measures are appropriate for. (3 points) EXPOSED ID # 2 3 4 6 7 8 9 10 11 12 13 14 15 NON-EXPOSED ID # 16 17 18 19 20 21 22 23 24 25 26 27 28 29 30 XXXXXX XXXXXXXXXXD L D XXXXXXXXXD YEAR OF STUDY YEAR OF STUDY 4- ACTIVE IN STUDY, AT RISK ACTIVE IN STUDY, DISEASED LOST TO FOLLOW-UP DIED XXXXX XXXXXX * 1 represents the examination at the end of year 1, 2 represents the examination at year 2, etc. When disease is diagnosed at the examination the letter "x" appears instead of the number" (e.g., the person with ID# 26 was diagnosed at the end of year 3). A blank space indicates that the person was not present at the examination. LEGEND FOR THIS FIGURE: xxxxD -5 XXX
Expert Answer:

Related Book For 

Income Tax Fundamentals 2013
ISBN: 9781285586618
31st Edition
Authors: Gerald E. Whittenburg, Martha Altus Buller, Steven L Gill
Posted Date:
Students also viewed these accounting questions
-
Answer the following questions using data from the Intel Corporation annual report in the appendix: Required: a. Find the discussion of depreciation methods used by Intel on page 695. Explain why the...
-
Answer the following questions using the data from Problem 14.42: a. Calculate the slope and the y intercept for the regression equation. b. Calculate the SST. c. Partition the SST into the SSR and...
-
Answer the following questions using the data from Problem 14.42: a. Calculate the coefficient of determination. b. Using α = 0.05, test the significance of the population coefficient...
-
Provide an overview of the OS and the manufacturer What is the footprint for the selected OS? What security architecture was implemented? How many CVEs does this OS have?
-
To acquire Kinston Corporation stock, R. Neal pays $62,000 in cash, plus $1,200 brokers fees. What entry should be made for this investment? Discuss.
-
? m e d i a t i o b s y s t e m s , a m e t h o d i f a l t e r n a t i v e d i s p u t e r e s o l u t i o b , a r e b e i n g c r e a t e d b y m a n y c o m p a n i e s s o t h a t
-
What item is the key figure (that is, 100 percent) in a common-size income statement? A commonsize balance sheet?
-
Trost Leasing Company buys equipment for leasing to various manufacturing companies. On October 1, 2010, Trost leases a press to Shumway Shoe Company. The cost of the machine to Trost was $196,110,...
-
Marcel has a whole life insurance policy with a face value of $75,000, a cash surrender value of $38,860, and an adjusted cost basis of $21,654. His annual premium of $3,655 is due March 10. If...
-
You work in the human resources department of your company helping new employees fill out the necessary paperwork to get their first paycheck. There are a number of decisions that employees must make...
-
ok mces Mills Corporation acquired as a long-term investment $225 million of 8% bonds, dated July 1, on July 1, 2024. Company management has classified the bonds as an available-for-sale investment....
-
Identify and explain the purpose of sources of current financing (debt and equity financing, short term and long term) answer accordingly by referring to the link given below to the financial report...
-
A manufacturer knows that their items have a normally distributed lifespan, with a mean of 4.3 years, and standard deviation of 0.5 years. If you randomly purchase 11 items, what is the probability...
-
1 Calculate the mean, median and standard deviation of the following data) 29 .104 .207 145 105 .124 All work should be done by hand, cannot use any software only use calculator
-
Explain the theoretical concepts that form the basis of the random walk hypothesis, and consider the implications of the efficient market hypothesis and the behavioural finance hypothesis when...
-
A line passes through the point (-8, 6) and has a slope of Write an equation in slope-intercept form for this line. 5 4
-
The first Difference-in-Differences analysis. 1 British physician John Snow was one of the fathers of modern epidemiology, the study of how illness moves through a population. Studying an outbreak of...
-
You are standing at x = 9.0 km and your assistant is standing at x = 3.0 km. Lightning bolt 1 strikes at x = 0 km and lightning bolt 2 strikes at x = 12.0 km. You see the flash from bolt 2 at t = 10...
-
Indicate, in each of the following situations, the number of exemptions the taxpayers are entitled to claim on their 2012 income tax returns. Number of Exemptions a. Donna, a 20-year-old single...
-
Quince Interests is a partnership with a tax year that ends September 30, 2012. During that year, Potter, a partner, received $3,000 per month as a guaranteed payment, and his share of partnership...
-
Steve Jackson (age 51) is a single taxpayer living at 3215 Pacific Dr., Del Mar, CA 92014. His Social Security number is 465-88-9415. In 2012, Steve's earnings and income tax withholding as the...
-
The Happy Valley Utility Company uses turnaround documents in its computerized customer accounting system. Meter readers are provided with preprinted com puter forms, each containing the account...
-
Rearrange the following items in chronological order to show how companies have evolved in incorporating quality concepts into organizational culture a. Emphasis on quality inspections. b. Adoption...
-
The Dewey Construction Company processes its payroll transactions to update both its payroll master file and its work-in-process master file in the same computer run. Both the payroll master file and...

Study smarter with the SolutionInn App