

The fish department of the local grocery store faces unique problems. Fish is extremely perishable and can
Question:
The fish department of the local grocery store faces unique problems. Fish is extremely perishable and can only be sold on the day it arrives in the store. Fish is delivered at 3 am and can be sold any time during the day until 3 am the next morning. Any fish left over at that time is given to a local charity.
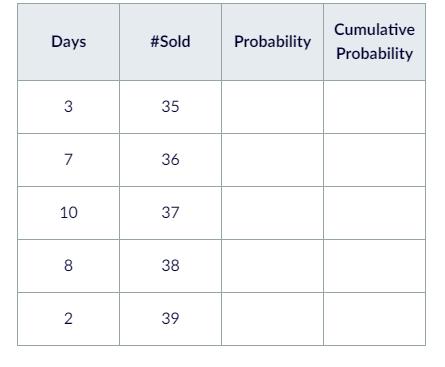
The department manager is reviewing the ordering process for flounder. She conducted an experiment for 30 days by ordering 40 flounders per day. This is above the highest demand usually observed and so does not limit the quantity demanded on any day. She found the following numbers of days for the quantity of flounder sold.
Instructions
Create a spreadsheet with the above data. Calculate the probability and cumulative probability table entries for the quantity of fish sold.
- Use the cumulative probabilities to construct a VLOOKUP table for use in the simulation.
- Construct a simulation for 1000 days. Assume the store orders 37 fish per day.
- Use the RAND () function of Excel to generate a random number and the VLOOKUP function to select the sales for each day. Calculate the quantity sold each day and the quantity left over.
- The store pays $2 to the supplier for each fish and makes a profit of $2 per flounder sold. Calculate the profit each day.
- Use the AVERAGE function to calculate the average quantity sold per day and the average quantity left over per day.
- What is the store’s average daily profit? There is no significant loss of goodwill for lost sales. Customers recognize that fish is highly perishable and understand that stores cannot afford to overstock them. In fact they would prefer to know that the store has a policy of only selling fish the same day.
- Rerun the simulation with different order quantities. Record the average daily profit for each run. Which order quantity gives the highest average daily profit?
- Using the order quantity that yields the highest daily profit, run the simulation 15 times, recording the average daily profit for each run
- In a Word document, record the answers to the following questions:
- Determine the average of the average daily profit figures for these 15 runs.
- What is the standard deviation?
- Then in a paragraph or two, discuss the implications of these results on the decision of the department manager.
Expert Answer:
Calculations for Probability and Cumulative Probability Days 3 7 10 8 2 Sold 35 36 37 38 39 Total Days 30 Days 371082 Sold 3536373839 Probability 1301... View the full answer


