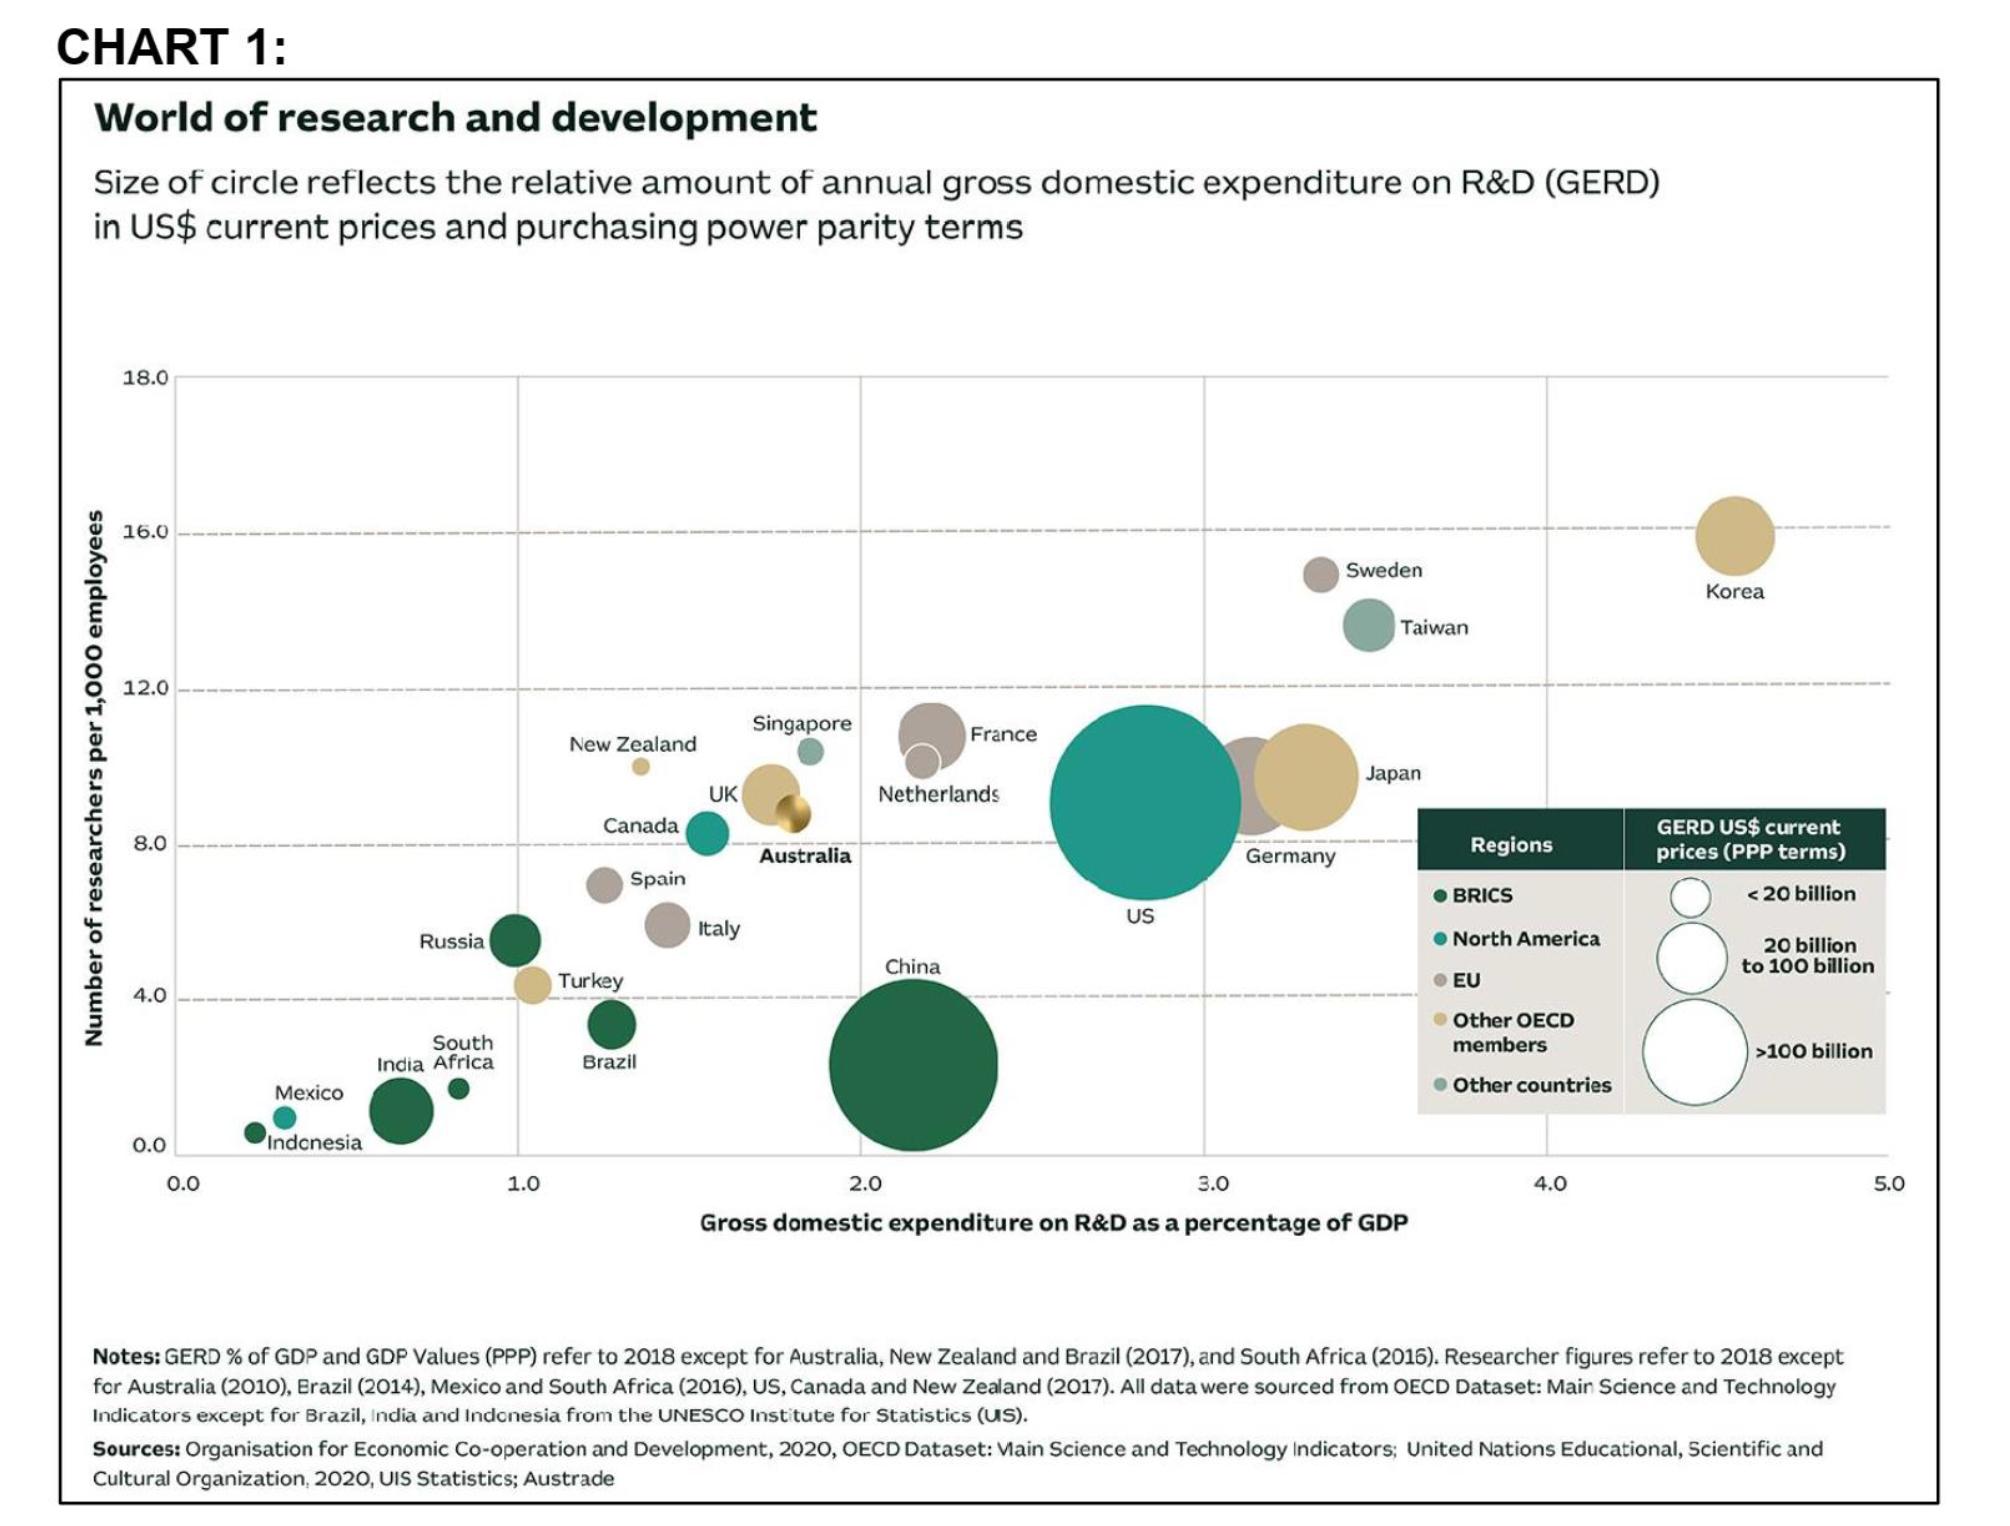
The following chart and accompanying text are reproduced from the Why Australia: Benchmark Report 2021 prepared...
Fantastic news! We've Found the answer you've been seeking!
Question:
Transcribed Image Text:
The following chart and accompanying text are reproduced from the "Why Australia: Benchmark Report 2021" prepared by Australian Trade Commission, Australian Government. "A big spender on research and development: Australia's annual gross domestic expenditure on research and development (GERD) reached A$34 billion in 2018-19. This places Australia alongside the UK, Singapore and France as one of the highest spenders on research and development (R&D). Australia's trend in R&D is upwards. GERD rose by around 7% per year from 2000-01 to 2018-19 and it now represents 1.8% of Australian GDP. This creates a pool of skilled researchers who are globally competitive." (i) Discuss the purpose of Chart 1 and critically assess how well it meets this purpose. (3 marks) (ii) Would you recommend that the data be presented in a different way? If not, why not? If so, explain how you would present the data in a better way. (2 marks) Activate Windows Go to Settings to activate Windo CHART 1: World of research and development Size of circle reflects the relative amount of annual gross domestic expenditure on R&D (GERD) in US$ current prices and purchasing power parity terms Number of researchers per 1,000 employees 18.0 16.0 12.0 8.0 4.0 0.0 0.0 Mexico Indonesia Russia South India Africa 1.0 New Zealand Canada Turkey Spain Brazil UK Italy Singapore Australia Netherlands 2.0 France China US 3.0 Germany Sweden Taiwan Japan Gross domestic expenditure on R&D as a percentage of GDP Regions BRICS North America EU Other OECD members Other countries 4.0 Korea GERD US$ current prices (PPP terms) < 20 billion 20 billion to 100 billion >100 billion Notes: GERD % of GDP and GDP Values (PPP) refer to 2018 except for Australia, New Zealand and Brazil (2017), and South Africa (2015). Researcher figures refer to 2018 except for Australia (2010), Brazil (2014), Mexico and South Africa (2016), US, Canada and New Zealand (2017). All data were sourced from OECD Dataset: Main Science and Technology Indicators except for Brazil, India and Indonesia from the UNESCO Institute for Statistics (US). Sources: Organisation for Economic Co-operation and Development, 2020, OECD Dataset: Main Science and Technology Indicators; United Nations Educational, Scientific and Cultural Organization, 2020, UIS Statistics; Austrade 5.0 The following chart and accompanying text are reproduced from the "Why Australia: Benchmark Report 2021" prepared by Australian Trade Commission, Australian Government. "A big spender on research and development: Australia's annual gross domestic expenditure on research and development (GERD) reached A$34 billion in 2018-19. This places Australia alongside the UK, Singapore and France as one of the highest spenders on research and development (R&D). Australia's trend in R&D is upwards. GERD rose by around 7% per year from 2000-01 to 2018-19 and it now represents 1.8% of Australian GDP. This creates a pool of skilled researchers who are globally competitive." (i) Discuss the purpose of Chart 1 and critically assess how well it meets this purpose. (3 marks) (ii) Would you recommend that the data be presented in a different way? If not, why not? If so, explain how you would present the data in a better way. (2 marks) Activate Windows Go to Settings to activate Windo CHART 1: World of research and development Size of circle reflects the relative amount of annual gross domestic expenditure on R&D (GERD) in US$ current prices and purchasing power parity terms Number of researchers per 1,000 employees 18.0 16.0 12.0 8.0 4.0 0.0 0.0 Mexico Indonesia Russia South India Africa 1.0 New Zealand Canada Turkey Spain Brazil UK Italy Singapore Australia Netherlands 2.0 France China US 3.0 Germany Sweden Taiwan Japan Gross domestic expenditure on R&D as a percentage of GDP Regions BRICS North America EU Other OECD members Other countries 4.0 Korea GERD US$ current prices (PPP terms) < 20 billion 20 billion to 100 billion >100 billion Notes: GERD % of GDP and GDP Values (PPP) refer to 2018 except for Australia, New Zealand and Brazil (2017), and South Africa (2015). Researcher figures refer to 2018 except for Australia (2010), Brazil (2014), Mexico and South Africa (2016), US, Canada and New Zealand (2017). All data were sourced from OECD Dataset: Main Science and Technology Indicators except for Brazil, India and Indonesia from the UNESCO Institute for Statistics (US). Sources: Organisation for Economic Co-operation and Development, 2020, OECD Dataset: Main Science and Technology Indicators; United Nations Educational, Scientific and Cultural Organization, 2020, UIS Statistics; Austrade 5.0
Expert Answer:
Answer rating: 100% (QA)
i The purpose of Chart 1 is to visually represent Australias annual gross domestic expenditure on research and development GERD and demonstrate its gr... View the full answer
Related Book For
Statistics For Business And Economics
ISBN: 9780132745659
8th Edition
Authors: Paul Newbold, William Carlson, Betty Thorne
Posted Date:
Students also viewed these economics questions
-
Planning is one of the most important management functions in any business. A front office managers first step in planning should involve determine the departments goals. Planning also includes...
-
A process stream is heated using a shell and tube heat exchanger. The exit temperature is controlled by adjusting the steam control valve shown in figure. During an open-loop experimental test, the...
-
When a motorcycle accelerates rapidly from a stop it sometimes "pops a wheelie"; that is, its front wheel may lift off the ground. Explain this behavior in terms of torques.
-
Air at 3.5 MPa and 38oC flows across a tube bank consisting of 400 tubes of 1.25-cm OD arranged in a staggered manner 20 rows high; Sp = 3.75 cm and Sn = 2.5 cm. The incoming-flow velocity is 9 m/s,...
-
Define derived domain. Could an information system be a derived domain? Explain.
-
Calculate the child credit for the following taxpayers. Please show your work. a. Jeremy is a single (head of household) father with a dependent 8-year-old son and $79,600 of AGI:...
-
How do strategic leaders leverage data-driven insights and emerging technologies to anticipate market trends and capitalize on strategic opportunities in a rapidly evolving landscape?
-
(a) Graph and shade the region enclosed by the curves y = 2-x and y = x. (b) Determine the volume of the solid obtained by rotating the shaded region about the line y = -1 along with the explanations...
-
Under HIPAA, health care providers must submit electronic claims if: a. they have fewer than 10 employees b. they have more than 10 employees c. they have more than 10 providers d. they have more...
-
An astronaut who was 2 0 years old left to explore the galaxy in 1 9 8 0 , on a spaceship travelling at 2 . 5 x 1 0 ^ 8 m / s . After 4 0 years of travel, how old does he appear to be ? Please answer...
-
5. The effective area of each plate of a parallel plate capacitor is with neoprene rubber (kappa = 6.4), 2.1m ^ 2 The capacitor is filled capacitor, the capacitor stores 4.0 of charge. Determine the...
-
Let A = (9,51) and B = (5,236), where the angles are measured counterclockwise from the positive x-axis. What is C = 4A + B? Give your answer in component form. x component: y component:
-
Oscillations in many devices such as musical instruments are desirable. However, many oscillations, such as those caused by winds or earthquakes, can be very destructive. ( a ) Define what is meant...
-
2. Compute: a) Pr(-3x3) if X-N(u=2, 0=4) b) Pr(2Y10) if Y~N(u=0, 0=4) c) Pr(-1.96W0) if W~N(u=0, 0=1) d) Pr(0U1.6) if U folllows a uniform distribution between 0 and 2 (that is, any number between 0...
-
In Exercises 1558, find each product. (9 - 5x) 2
-
Independent random samples of 101 college sophomores, 112 college juniors, and 96 college seniors were asked to rate, on a scale of 1 to 7, the importance attached to brand name when purchasing a...
-
In a large corporation, 80% of the employees are men and 20% are women. The highest levels of education obtained by the employees are graduate training for 10% of the men, undergraduate training for...
-
Would you use the library more if the hours were extended? From a random sample of 138 freshmen, 80 indicated that they would use the schools library more if the hours were extended. In an...
-
Factor (smart beta) strategy ETFs are least likely to be used by investors: A. to modify portfolio risk. B. for tactical trading purposes. C. to seek outperformance versus a benchmark.
-
Which of the following statements regarding applications of ETFs in portfolio management is correct? A. Equity ETFs tend to be more active than fixed-income ETFs. B. The range of risk exposures...
-
Which of Stosurs statements regarding ETF mechanics is correct? A. Statement 1 B. Statement 2 C. Statement 3 Howie Rutledge is a senior portfolio strategist for an endowment fund. Rutledge meets with...
Study smarter with the SolutionInn App