

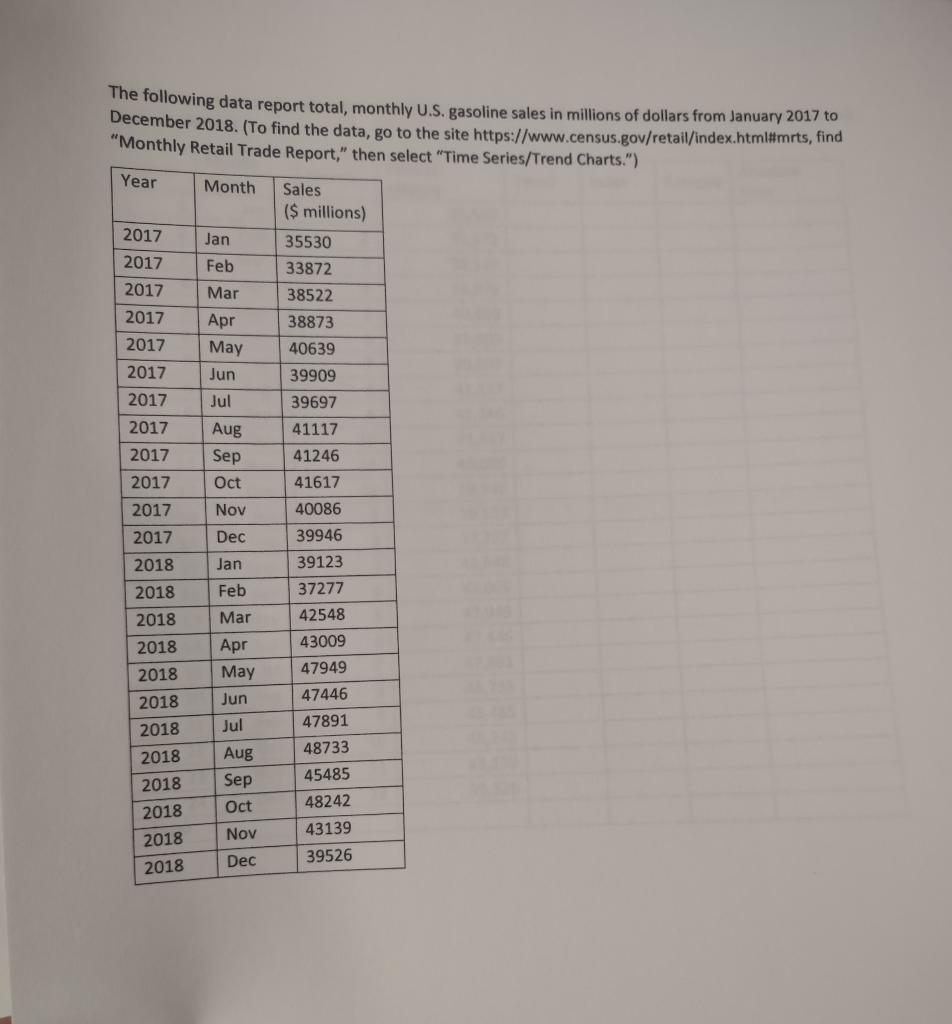
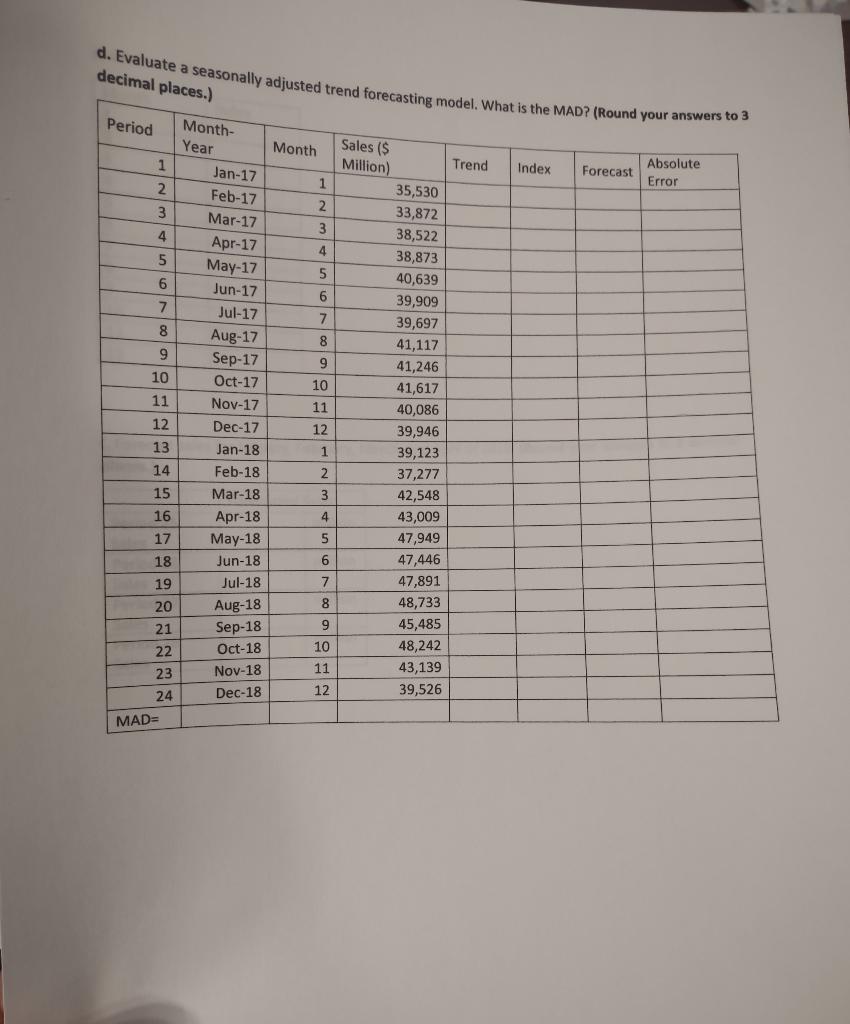
The following data report total, monthly U.S. gasoline sales in millions of dollars from January 2017...
Fantastic news! We've Found the answer you've been seeking!
Question:

Expert Answer:

Related Book For 

Statistical Techniques in Business and Economics
ISBN: 9781260239478
18th Edition
Authors: Douglas Lind, William Marchal, Samuel Wathen
Posted Date:
