

The following data represent the speed at which a ball was hit (in miles per hour)...
Fantastic news! We've Found the answer you've been seeking!
Question:
Transcribed Image Text:
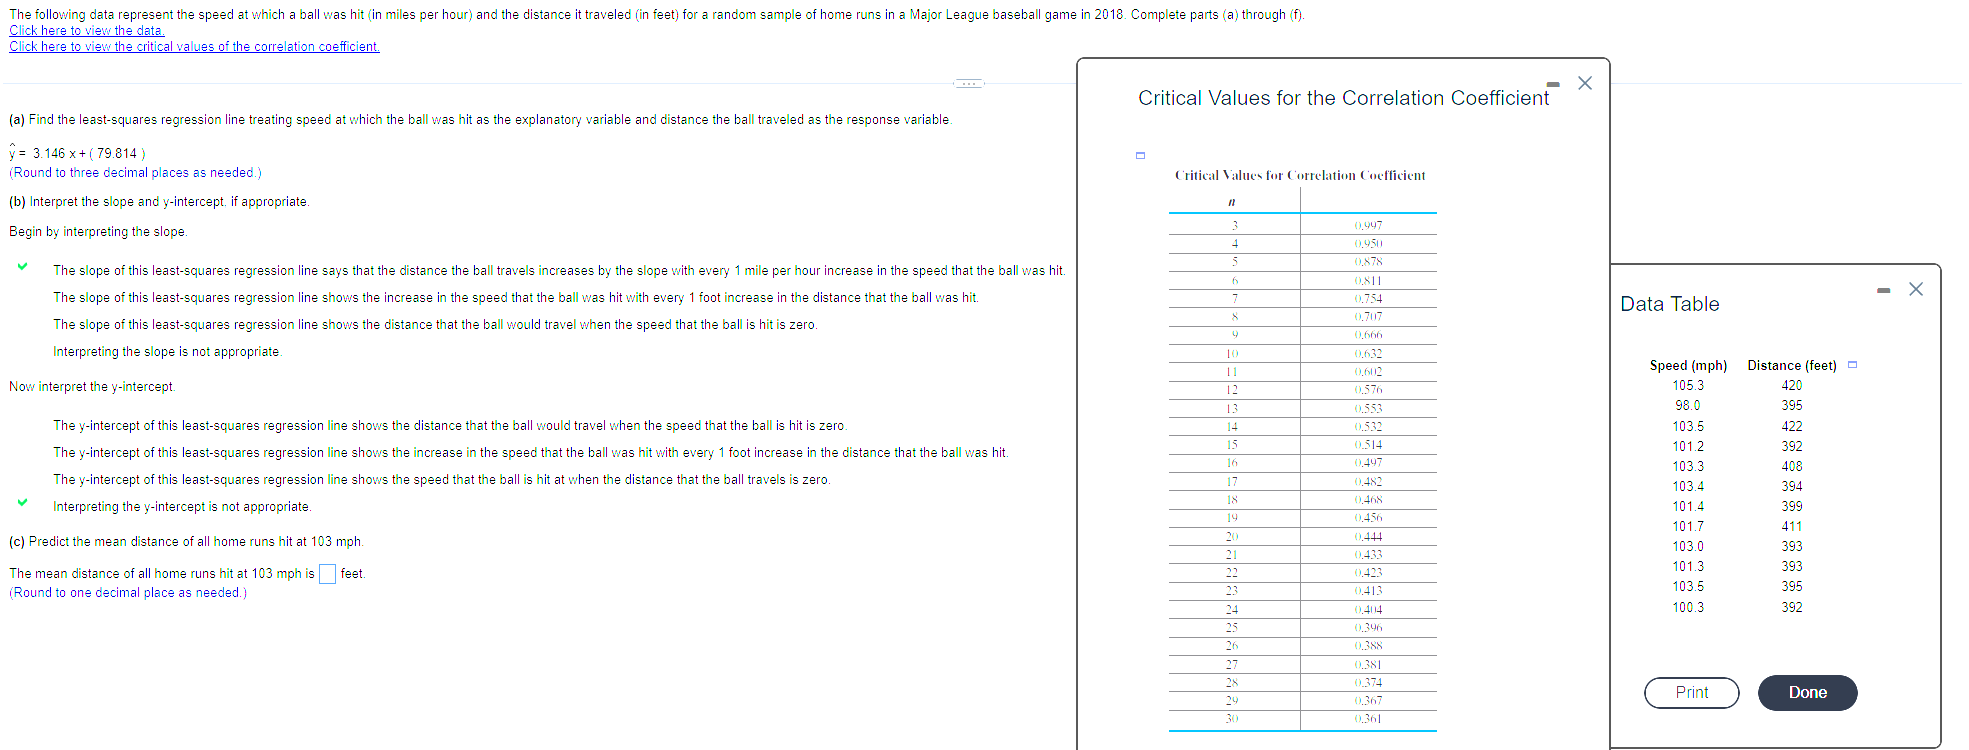
The following data represent the speed at which a ball was hit (in miles per hour) and the distance it traveled (in feet) for a random sample of home runs in a Major League baseball game in 2018. Complete parts (a) through (f). Click here to view the critical values of the correlation coefficient. Click here to view the data. (a) Find the least-squares regression line treating speed at which the ball was hit as the explanatory variable and distance the ball traveled as the response variable. y= 3.146 x + (79.814) (Round to three decimal places as needed.) (b) Interpret the slope and y-intercept. if appropriate. Critical Values for the Correlation Coefficient Critical Values for Correlation Coefficient " 0,997 Begin by interpreting the slope. 4 0,950 5 0.878 The slope of this least-squares regression line says that the distance the ball travels increases by the slope with every 1 mile per hour increase in the speed that the ball was hit. The slope of this least-squares regression line shows the increase in the speed that the ball was hit with every 1 foot increase in the distance that the ball was hit. f 0.811 7 0.754 Data Table 8 0,707 The slope of this least-squares regression line shows the distance that the ball would travel when the speed that the ball is hit is zero. Interpreting the slope is not appropriate. Now interpret the y-intercept. 9 0,666 10 0.632 11 0,602 Speed (mph) Distance (feet) 12 0.576 105.3 420 13 0.553 98.0 395 The y-intercept of this least-squares regression line shows the distance that the ball would travel when the speed that the ball is hit is zero. 14 0.532 103.5 422 15 0.514 101.2 392 The y-intercept of this least-squares regression line shows the increase in the speed that the ball was hit with every 1 foot increase in the distance that the ball was hit. The y-intercept of this least-squares regression line shows the speed that the ball is hit at when the distance that the ball travels is zero. Interpreting the y-intercept is not appropriate. (c) Predict the mean distance of all home runs hit at 103 mph. 16 0.497 103.3 408 17 0.482 103.4 394 18 0,468 101.4 399 19 0.456 101.7 411 20 0.444 103.0 393 21 0.433 101.3 393 The mean distance of all home runs hit at 103 mph is (Round to one decimal place as needed.) feet. 22 0.423 23 0.413 103.5 395 24 0,404 100.3 392 25 0.396 26 0.388 27 0.381 28 0.374 Print Done 29 0.367 30 0.361 The following data represent the speed at which a ball was hit (in miles per hour) and the distance it traveled (in feet) for a random sample of home runs in a Major League baseball game in 2018. Complete parts (a) through (f). Click here to view the critical values of the correlation coefficient. Click here to view the data. (a) Find the least-squares regression line treating speed at which the ball was hit as the explanatory variable and distance the ball traveled as the response variable. y= 3.146 x + (79.814) (Round to three decimal places as needed.) (b) Interpret the slope and y-intercept. if appropriate. Critical Values for the Correlation Coefficient Critical Values for Correlation Coefficient " 0,997 Begin by interpreting the slope. 4 0,950 5 0.878 The slope of this least-squares regression line says that the distance the ball travels increases by the slope with every 1 mile per hour increase in the speed that the ball was hit. The slope of this least-squares regression line shows the increase in the speed that the ball was hit with every 1 foot increase in the distance that the ball was hit. f 0.811 7 0.754 Data Table 8 0,707 The slope of this least-squares regression line shows the distance that the ball would travel when the speed that the ball is hit is zero. Interpreting the slope is not appropriate. Now interpret the y-intercept. 9 0,666 10 0.632 11 0,602 Speed (mph) Distance (feet) 12 0.576 105.3 420 13 0.553 98.0 395 The y-intercept of this least-squares regression line shows the distance that the ball would travel when the speed that the ball is hit is zero. 14 0.532 103.5 422 15 0.514 101.2 392 The y-intercept of this least-squares regression line shows the increase in the speed that the ball was hit with every 1 foot increase in the distance that the ball was hit. The y-intercept of this least-squares regression line shows the speed that the ball is hit at when the distance that the ball travels is zero. Interpreting the y-intercept is not appropriate. (c) Predict the mean distance of all home runs hit at 103 mph. 16 0.497 103.3 408 17 0.482 103.4 394 18 0,468 101.4 399 19 0.456 101.7 411 20 0.444 103.0 393 21 0.433 101.3 393 The mean distance of all home runs hit at 103 mph is (Round to one decimal place as needed.) feet. 22 0.423 23 0.413 103.5 395 24 0,404 100.3 392 25 0.396 26 0.388 27 0.381 28 0.374 Print Done 29 0.367 30 0.361
Expert Answer:

Posted Date:
Students also viewed these mathematics questions
-
How does the ERM system help with timely, effective, and democratic business decisions? A) Reporting to the presidents of each unit a faculty in a method that allows silo type decisions B) Board...
-
Explain how payoff matrices used in Game Theory illustrate mutual interdependence among firms in oligopolies. How can they be used to predict likely outcomes?
-
Refer to the preceding problem. For each case, determine CVFs tax basis in the security received in the exchange. Assume the taxable year is 2018. Data from Prob. 19 CVF owned 2,000 shares of Jarvis...
-
Who in an organization may be held responsible for a labor rate variance? A materials price variance?
-
Quester Company operates a large discount store and uses the retail method to estimate the cost of ending inventory . Management suspects that in recent weeks there have been unusually heavy losses...
-
Make a COMPANY DESCRIPTION The company is: A network designer Designer of a campus network Technology company
-
The spot price of oil is $80 per barrel and the cost of storing a barrel of oil for one year is $3, payable at the end of the year. The risk-free interest rate is 5% per annum, continuously...
-
Explain the legal and ethical issues surrounding the payment of trailing commissions to finance and mortgage brokers and advisers (Explain the legal environment including disclosure and compliance...
-
. 1. Explain, that capital expenditures help increase assets, yet other cash flows like taxes and paying salary do not do so but create an instant expense on the income statement, which then...
-
Given a vector: vector vectorArray = {1,2,3,4,5}; Below is how we traverse through it: for (int i = 0; i < vectorArray .size(); i++) { } //do somthine with vectorArray[i] Apply the same idea, if we...
-
7. Sam prices a put option with the Black-Scholes-Merton option pricing model and concludes the premium equal $25. The present value of expected exposure (EE) is $25 for this option. Sam estimates...
-
Scrap value of turbines is non-existent but there will be decommissioning costs incurred when a windfarm ceases to operate. If VFS closes the proposed new windfarm at 30 June 2026, the...
-
Separately from the analysis in the previous question, Mathews Valuation Consultants has concluded that the equity cost of capital is 9.1%. Using the below data and the 9.1% estimate: what is the...
-
An item of depreciable machinery was acquired on 1 July 2009 for $120,000 by cash It is expected to have a useful life of 10 years and zero salvage value On 1 July 2012, it was decided to revalue the...

Study smarter with the SolutionInn App