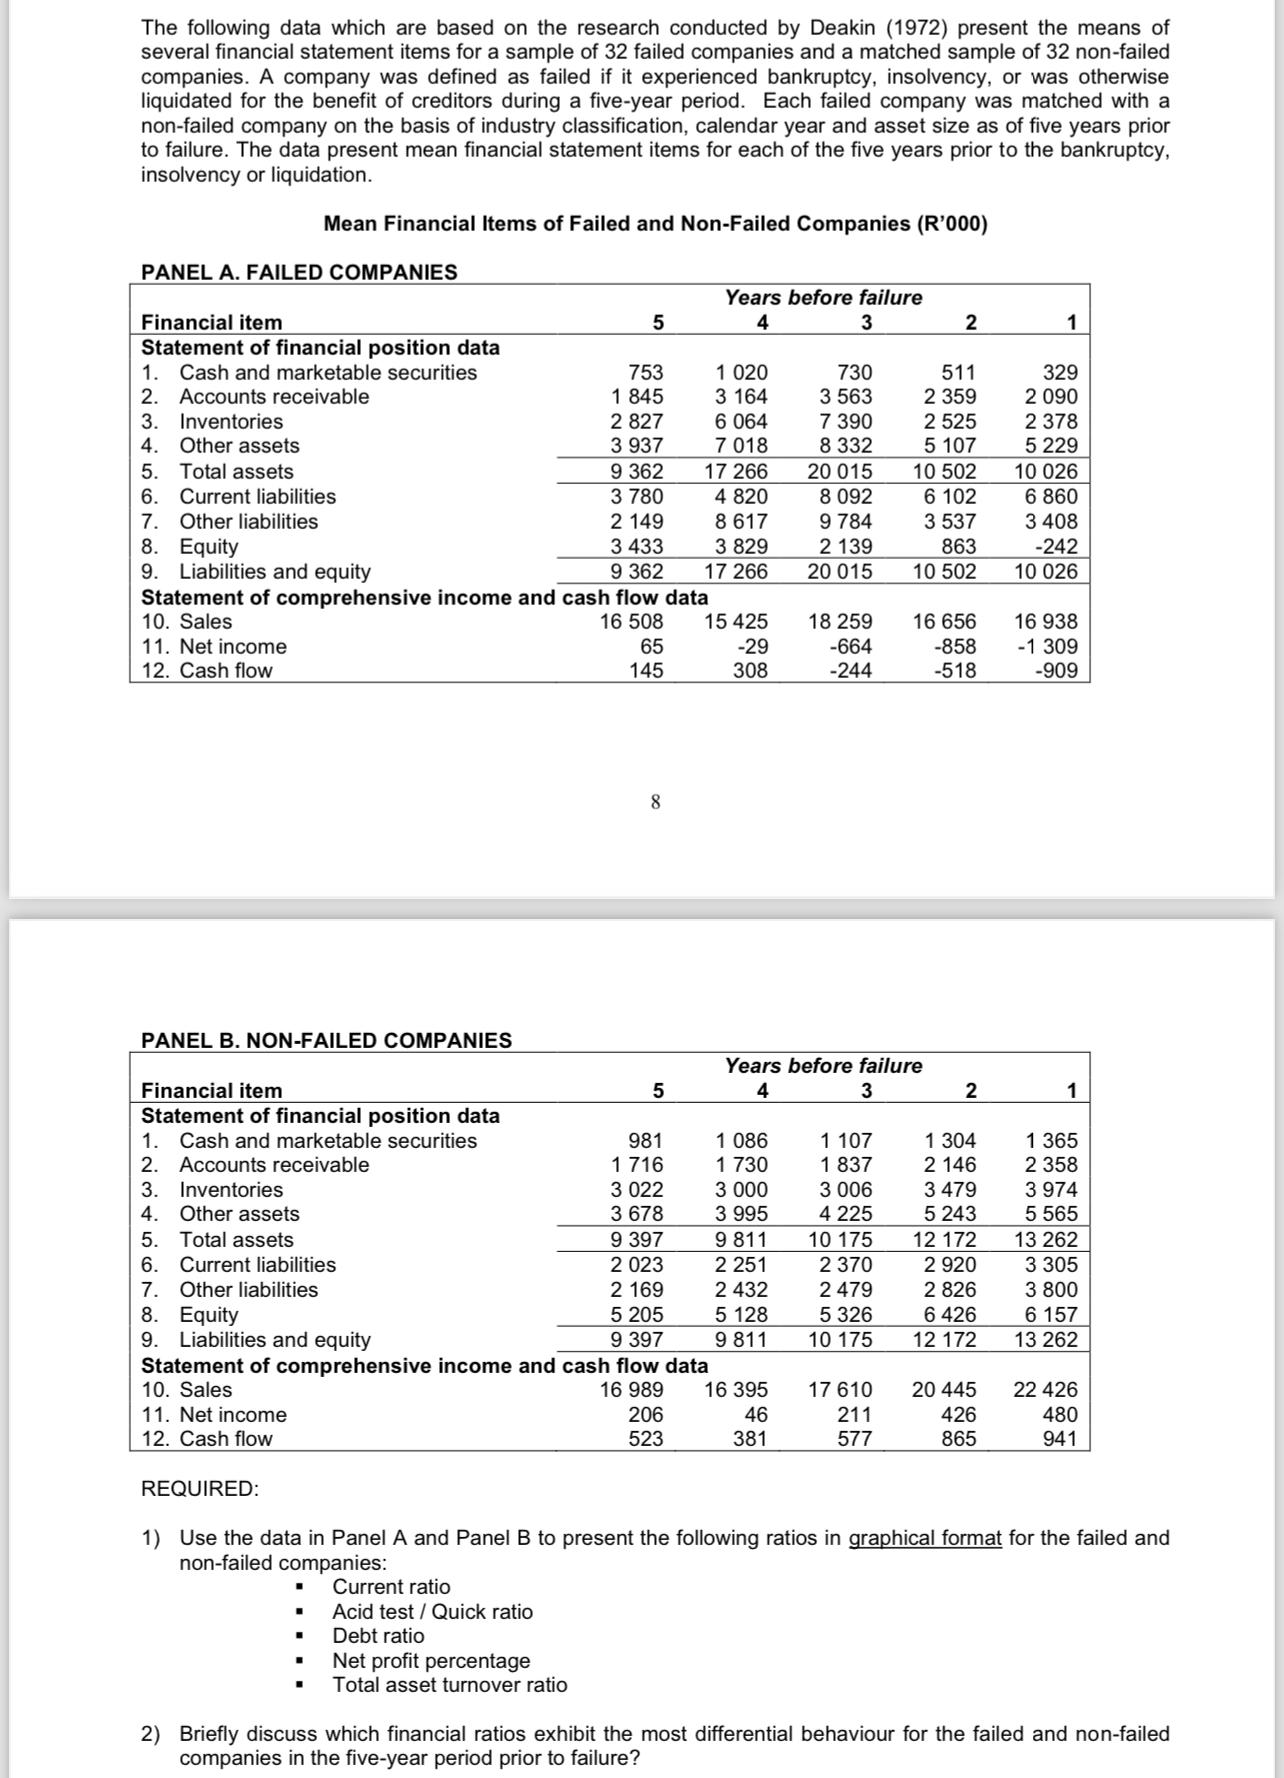
The following data which are based on the research conducted by Deakin (1972) present the means...
Fantastic news! We've Found the answer you've been seeking!
Question:
Transcribed Image Text:
The following data which are based on the research conducted by Deakin (1972) present the means of several financial statement items for a sample of 32 failed companies and a matched sample of 32 non-failed companies. A company was defined as failed if it experienced bankruptcy, insolvency, or was otherwise liquidated for the benefit of creditors during a five-year period. Each failed company was matched with a non-failed company on the basis of industry classification, calendar year and asset size as of five years prior to failure. The data present mean financial statement items for each of the five years prior to the bankruptcy, insolvency or liquidation. Mean Financial Items of Failed and Non-Failed Companies (R'000) PANEL A. FAILED COMPANIES Financial item 5 Years before failure 4 3 2 1 Statement of financial position data 1. Cash and marketable securities 2. Accounts receivable 753 1 020 730 511 329 1 845 3 164 3 563 2 359 2 090 3. Inventories 2 827 6 064 7 390 2 525 2 378 4. Other assets 3 937 7 018 8 332 5 107 5 229 5. Total assets 9 362 17 266 20 015 10 502 10 026 6. Current liabilities 3 780 4 820 8 092 6 102 6 860 7. Other liabilities 2 149 8 617 9 784 3 537 3 408 8. Equity 3 433 3 829 2 139 863 -242 9. Liabilities and equity 9 362 17 266 20 015 10 502 10 026 Statement of comprehensive income and cash flow data 10. Sales 16 508 15 425 18 259 16 656 16 938 11. Net income 65 -29 -664 -858 -1 309 12. Cash flow 145 308 -244 -518 -909 8 PANEL B. NON-FAILED COMPANIES Financial item 5 Years before failure 4 3 2 1 Statement of financial position data 1. Cash and marketable securities 981 1 086 1 107 1 304 1 365 2. Accounts receivable 1 716 1 730 1 837 2 146 2 358 3. Inventories 3 022 3 000 3 006 3 479 3 974 4. Other assets 5. Total assets 6. Current liabilities 3 678 3 995 4 225 5 243 5565 9 397 9 811 10 175 12 172 13 262 2 023 2 251 2 370 2 920 3 305 7. Other liabilities 2169 2 432 2 479 2 826 3 800 8. Equity 5 205 5 128 5 326 6426 6 157 9. Liabilities and equity 9 397 9 811 10 175 12 172 13 262 Statement of comprehensive income and cash flow data 10. Sales 16 989 16 395 17 610 11. Net income 206 46 12. Cash flow 523 381 211 577 20 445 426 22 426 480 865 941 REQUIRED: 1) Use the data in Panel A and Panel B to present the following ratios in graphical format for the failed and non-failed companies: Current ratio " Acid test/Quick ratio Debt ratio Net profit percentage Total asset turnover ratio 2) Briefly discuss which financial ratios exhibit the most differential behaviour for the failed and non-failed companies in the five-year period prior to failure? Select any company of your choice listed on the Johannesburg Stock Exchange. Using the company's financial statements (covering five financial periods) you are required to: 1) Calculate the following ratios (for the financial years ending 2019-2023: . Current ratio Acid test/Quick ratio Debt ratio Net profit percentage Total asset turnover ratio 2) Use a graphical approach to compare the ratios of your selected company to those in Part A above (failed and non-failed companies). Briefly discuss whether the ratios for your selected company resemble The following data which are based on the research conducted by Deakin (1972) present the means of several financial statement items for a sample of 32 failed companies and a matched sample of 32 non-failed companies. A company was defined as failed if it experienced bankruptcy, insolvency, or was otherwise liquidated for the benefit of creditors during a five-year period. Each failed company was matched with a non-failed company on the basis of industry classification, calendar year and asset size as of five years prior to failure. The data present mean financial statement items for each of the five years prior to the bankruptcy, insolvency or liquidation. Mean Financial Items of Failed and Non-Failed Companies (R'000) PANEL A. FAILED COMPANIES Financial item 5 Years before failure 4 3 2 1 Statement of financial position data 1. Cash and marketable securities 2. Accounts receivable 753 1 020 730 511 329 1 845 3 164 3 563 2 359 2 090 3. Inventories 2 827 6 064 7 390 2 525 2 378 4. Other assets 3 937 7 018 8 332 5 107 5 229 5. Total assets 9 362 17 266 20 015 10 502 10 026 6. Current liabilities 3 780 4 820 8 092 6 102 6 860 7. Other liabilities 2 149 8 617 9 784 3 537 3 408 8. Equity 3 433 3 829 2 139 863 -242 9. Liabilities and equity 9 362 17 266 20 015 10 502 10 026 Statement of comprehensive income and cash flow data 10. Sales 16 508 15 425 18 259 16 656 16 938 11. Net income 65 -29 -664 -858 -1 309 12. Cash flow 145 308 -244 -518 -909 8 PANEL B. NON-FAILED COMPANIES Financial item 5 Years before failure 4 3 2 1 Statement of financial position data 1. Cash and marketable securities 981 1 086 1 107 1 304 1 365 2. Accounts receivable 1 716 1 730 1 837 2 146 2 358 3. Inventories 3 022 3 000 3 006 3 479 3 974 4. Other assets 5. Total assets 6. Current liabilities 3 678 3 995 4 225 5 243 5565 9 397 9 811 10 175 12 172 13 262 2 023 2 251 2 370 2 920 3 305 7. Other liabilities 2169 2 432 2 479 2 826 3 800 8. Equity 5 205 5 128 5 326 6426 6 157 9. Liabilities and equity 9 397 9 811 10 175 12 172 13 262 Statement of comprehensive income and cash flow data 10. Sales 16 989 16 395 17 610 11. Net income 206 46 12. Cash flow 523 381 211 577 20 445 426 22 426 480 865 941 REQUIRED: 1) Use the data in Panel A and Panel B to present the following ratios in graphical format for the failed and non-failed companies: Current ratio " Acid test/Quick ratio Debt ratio Net profit percentage Total asset turnover ratio 2) Briefly discuss which financial ratios exhibit the most differential behaviour for the failed and non-failed companies in the five-year period prior to failure? Select any company of your choice listed on the Johannesburg Stock Exchange. Using the company's financial statements (covering five financial periods) you are required to: 1) Calculate the following ratios (for the financial years ending 2019-2023: . Current ratio Acid test/Quick ratio Debt ratio Net profit percentage Total asset turnover ratio 2) Use a graphical approach to compare the ratios of your selected company to those in Part A above (failed and non-failed companies). Briefly discuss whether the ratios for your selected company resemble
Expert Answer:
Related Book For
Business Statistics In Practice
ISBN: 9780073401836
6th Edition
Authors: Bruce Bowerman, Richard O'Connell
Posted Date:
Students also viewed these accounting questions
-
Listed below are several terms and phrases associated with property, plant, and equipment and intangible assets. Pair each item from List A with the item from List B (by letter) that is most...
-
Mansfield Congregational Church (MCC) is a small organization in Connecticut with only seventeen employees. Though its funds are dwindling, the MCC wants to hire a full-time maintenance employee to...
-
The accompanying table contains data on the U.S. economy for the years 1983 and 2010. The second column shows the poverty threshold. The third column shows the consumer price index (CPI), a measure...
-
A call option with a strike price of $50 costs $2. A put option with a strike price of $45 costs $3. Explain how a strangle can be created from these two options. What is the pattern of profits from...
-
Compute the exclusive and inclusive ranges for the following items. High Score Low Score Inclusive Range Exclusive Range 7 6 89 45 34 17 15 2 1 1
-
Palvo Sorokin is a venture capitalist facing two alternative investment opportunities. He intends to invest $1 million in a start-up firm. He is nervous, however, about future economic volatility. He...
-
PART 1: A heuristic is a "rule of thumb," or a good guide to follow when making decisions. Share some of the heuristics that you use to maintain an adequate relationship with your coworkers and...
-
9.5.29 Question Help The accompanying data provide the winning distances for three separate competitions in a long-running international sporting event Develop forecasting models for each of the...
-
What is meant by a control premium? Who are the primary beneficiaries in M&As?
-
What are the risks faced by exporters?
-
Why are confirmed letters of credit an effective hedge against country risk?
-
Why is China accumulating forex reserves so rapidly? Is its balance of payments indeed balancing?
-
Explain how letters of credit are used for international trade financing purposes.
-
Esperanza watched as her mother got her flu shot. Why do you need a shot if youre not sick? she asked. So I wont get sick, answered her mom. Explain how the influenza vaccination prevents illness.
-
Which of the followingcarbocations is the least stable? CH3CH2 . CH3CHCH3 CH3 I . CH3C0 T CH3 IV. V. CH3 CH3CCH2 CH3
-
Define thermal efficiency of a heat engine.
-
What are the limitations of Carnot cycle?
-
Differentiate between a heat pump and a refrigerator.
Study smarter with the SolutionInn App