

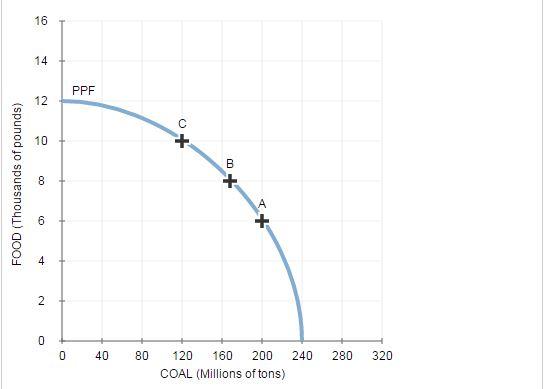
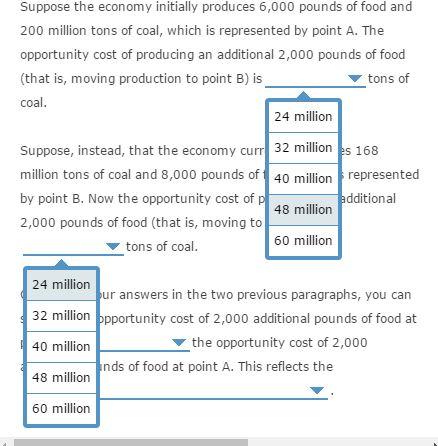
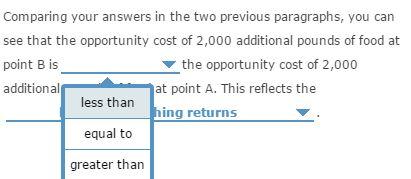
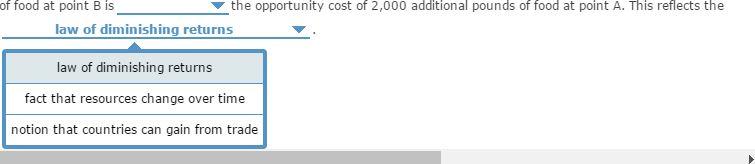
The following graph shows the production possibilities frontier (PPF) of an economy that produces food and coal.
Fantastic news! We've Found the answer you've been seeking!
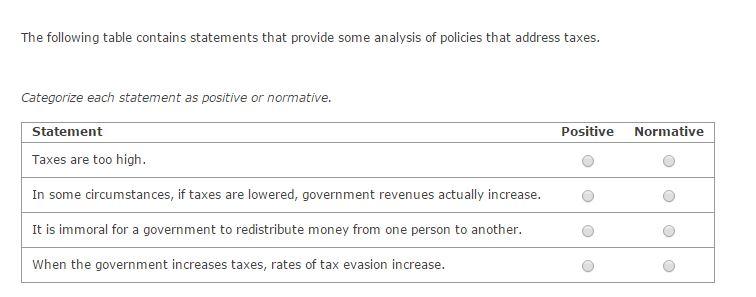
Question:
The following graph shows the production possibilities frontier (PPF) of an economy that produces food and coal. The black points (plus symbols) represent three possible output combinations in a given month. You can click on the points to see their exact coordinates.
Question#13
Expert Answer:

Related Book For 
Posted Date:
