

The following graph shows the volume of wood produced in a single-species forest. Here f ( t
Fantastic news! We've Found the answer you've been seeking!
Question:
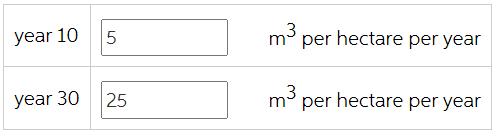
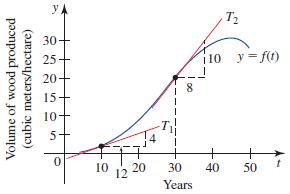
The following graph shows the volume of wood produced in a single-species forest. Here f(t) is measured in cubic meters per hectare and t is measured in years. By computing the slopes of the respective tangent lines, estimate the rate at which the wood grown is changing at the beginning of year 10 and at the beginning of year 30.

Expert Answer:

Related Book For 

Posted Date:
