

The following table contains time series data for regular gasoline prices in the United States for...
Fantastic news! We've Found the answer you've been seeking!
Question:
Transcribed Image Text:
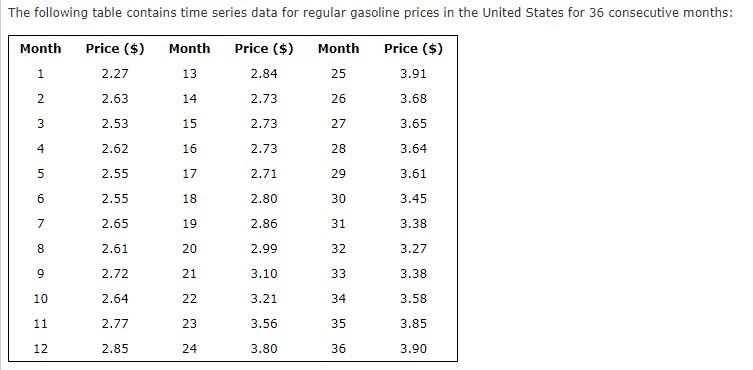
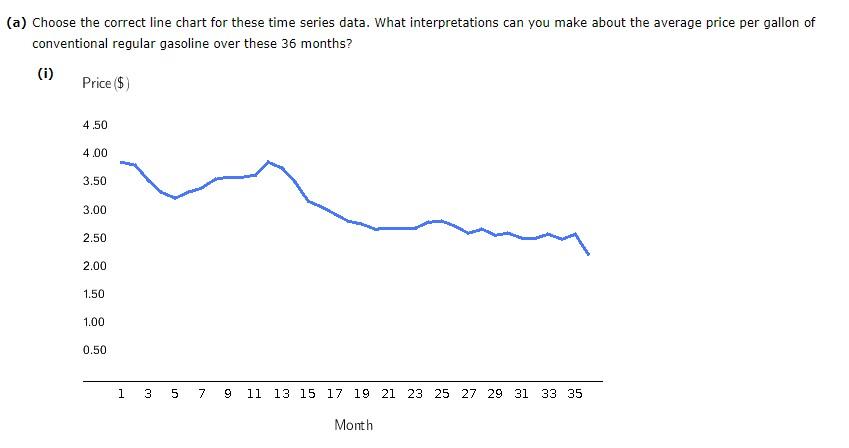
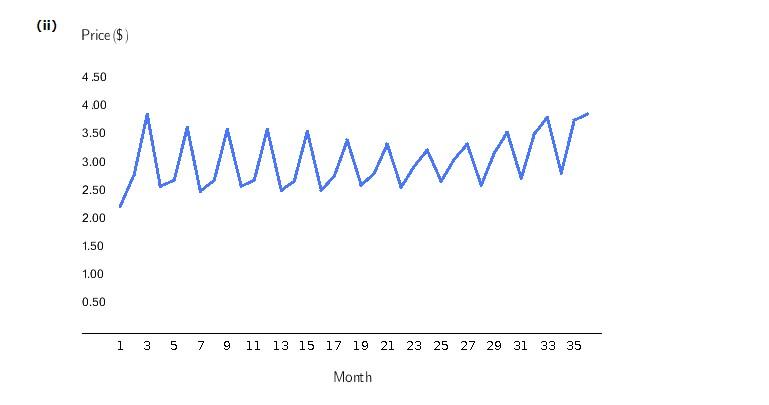
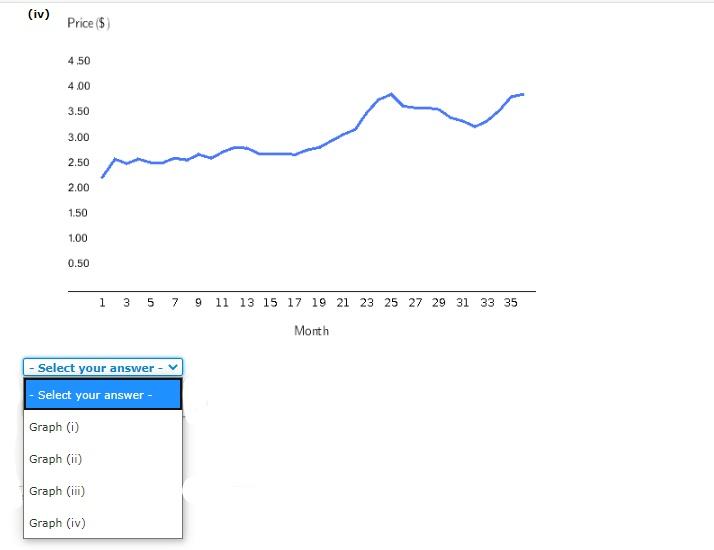
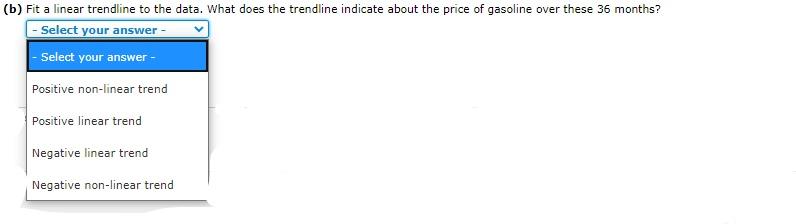
The following table contains time series data for regular gasoline prices in the United States for 36 consecutive months: Month Price ($) Month Price ($) Month Price ($) 2.27 13 2.84 25 3.91 2. 2.63 14 2.73 26 3.68 2.53 15 2.73 27 3.65 4 2.62 16 2.73 28 3.64 2.55 17 2.71 29 3.61 2.55 18 2.80 30 3.45 7 2.65 19 2.86 31 3.38 8 2.61 20 2.99 32 3.27 9. 2.72 21 3.10 33 3.38 10 2.64 22 3.21 34 3.58 11 2.77 23 3.56 35 3.85 12 2.85 24 3.80 36 3.90 (a) Choose the correct line chart for these time series data. What interpretations can you make about the average price per gallon of conventional regular gasoline over these 36 months? (i) Price ($) 4.50 4.00 3.50 3.00 2.50 2.00 1.50 1.00 0.50 1 3 5 7 9 11 13 15 17 19 21 23 25 27 29 31 33 35 Month (ii) Price ($) 4.50 4.00 3.50 ww 3.00 2.50 2.00 1.50 1.00 0.50 1 3 5 7 9 11 13 15 17 19 21 23 25 27 29 31 33 35 Month (iii) Price ($) 4.50 4.00 3.50 3.00 2.50 2.00 1.50 1.00 0.50 1 7 11 13 15 17 19 21 23 25 27 29 31 33 35 Month 3, (iv) Price ($) 4,50 4.00 3.50 3.00 2.50 2.00 1.50 1.00 0.50 1 3 5 7 9 11 13 15 17 19 21 23 25 27 29 31 33 35 Month - Select your answer Select your answer - Graph (i) Graph (ii) Graph (iii) Graph (iv) (b) Fit a linear trendline to the data. What does the trendline indicate about the price of gasoline over these 36 months? - Select your answer - - Select your answer - Positive non-linear trend Positive linear trend Negative linear trend Negative non-linear trend The following table contains time series data for regular gasoline prices in the United States for 36 consecutive months: Month Price ($) Month Price ($) Month Price ($) 2.27 13 2.84 25 3.91 2. 2.63 14 2.73 26 3.68 2.53 15 2.73 27 3.65 4 2.62 16 2.73 28 3.64 2.55 17 2.71 29 3.61 2.55 18 2.80 30 3.45 7 2.65 19 2.86 31 3.38 8 2.61 20 2.99 32 3.27 9. 2.72 21 3.10 33 3.38 10 2.64 22 3.21 34 3.58 11 2.77 23 3.56 35 3.85 12 2.85 24 3.80 36 3.90 (a) Choose the correct line chart for these time series data. What interpretations can you make about the average price per gallon of conventional regular gasoline over these 36 months? (i) Price ($) 4.50 4.00 3.50 3.00 2.50 2.00 1.50 1.00 0.50 1 3 5 7 9 11 13 15 17 19 21 23 25 27 29 31 33 35 Month (ii) Price ($) 4.50 4.00 3.50 ww 3.00 2.50 2.00 1.50 1.00 0.50 1 3 5 7 9 11 13 15 17 19 21 23 25 27 29 31 33 35 Month (iii) Price ($) 4.50 4.00 3.50 3.00 2.50 2.00 1.50 1.00 0.50 1 7 11 13 15 17 19 21 23 25 27 29 31 33 35 Month 3, (iv) Price ($) 4,50 4.00 3.50 3.00 2.50 2.00 1.50 1.00 0.50 1 3 5 7 9 11 13 15 17 19 21 23 25 27 29 31 33 35 Month - Select your answer Select your answer - Graph (i) Graph (ii) Graph (iii) Graph (iv) (b) Fit a linear trendline to the data. What does the trendline indicate about the price of gasoline over these 36 months? - Select your answer - - Select your answer - Positive non-linear trend Positive linear trend Negative linear trend Negative non-linear trend The following table contains time series data for regular gasoline prices in the United States for 36 consecutive months: Month Price ($) Month Price ($) Month Price ($) 2.27 13 2.84 25 3.91 2. 2.63 14 2.73 26 3.68 2.53 15 2.73 27 3.65 4 2.62 16 2.73 28 3.64 2.55 17 2.71 29 3.61 2.55 18 2.80 30 3.45 7 2.65 19 2.86 31 3.38 8 2.61 20 2.99 32 3.27 9. 2.72 21 3.10 33 3.38 10 2.64 22 3.21 34 3.58 11 2.77 23 3.56 35 3.85 12 2.85 24 3.80 36 3.90 (a) Choose the correct line chart for these time series data. What interpretations can you make about the average price per gallon of conventional regular gasoline over these 36 months? (i) Price ($) 4.50 4.00 3.50 3.00 2.50 2.00 1.50 1.00 0.50 1 3 5 7 9 11 13 15 17 19 21 23 25 27 29 31 33 35 Month (ii) Price ($) 4.50 4.00 3.50 ww 3.00 2.50 2.00 1.50 1.00 0.50 1 3 5 7 9 11 13 15 17 19 21 23 25 27 29 31 33 35 Month (iii) Price ($) 4.50 4.00 3.50 3.00 2.50 2.00 1.50 1.00 0.50 1 7 11 13 15 17 19 21 23 25 27 29 31 33 35 Month 3, (iv) Price ($) 4,50 4.00 3.50 3.00 2.50 2.00 1.50 1.00 0.50 1 3 5 7 9 11 13 15 17 19 21 23 25 27 29 31 33 35 Month - Select your answer Select your answer - Graph (i) Graph (ii) Graph (iii) Graph (iv) (b) Fit a linear trendline to the data. What does the trendline indicate about the price of gasoline over these 36 months? - Select your answer - - Select your answer - Positive non-linear trend Positive linear trend Negative linear trend Negative non-linear trend The following table contains time series data for regular gasoline prices in the United States for 36 consecutive months: Month Price ($) Month Price ($) Month Price ($) 2.27 13 2.84 25 3.91 2. 2.63 14 2.73 26 3.68 2.53 15 2.73 27 3.65 4 2.62 16 2.73 28 3.64 2.55 17 2.71 29 3.61 2.55 18 2.80 30 3.45 7 2.65 19 2.86 31 3.38 8 2.61 20 2.99 32 3.27 9. 2.72 21 3.10 33 3.38 10 2.64 22 3.21 34 3.58 11 2.77 23 3.56 35 3.85 12 2.85 24 3.80 36 3.90 (a) Choose the correct line chart for these time series data. What interpretations can you make about the average price per gallon of conventional regular gasoline over these 36 months? (i) Price ($) 4.50 4.00 3.50 3.00 2.50 2.00 1.50 1.00 0.50 1 3 5 7 9 11 13 15 17 19 21 23 25 27 29 31 33 35 Month (ii) Price ($) 4.50 4.00 3.50 ww 3.00 2.50 2.00 1.50 1.00 0.50 1 3 5 7 9 11 13 15 17 19 21 23 25 27 29 31 33 35 Month (iii) Price ($) 4.50 4.00 3.50 3.00 2.50 2.00 1.50 1.00 0.50 1 7 11 13 15 17 19 21 23 25 27 29 31 33 35 Month 3, (iv) Price ($) 4,50 4.00 3.50 3.00 2.50 2.00 1.50 1.00 0.50 1 3 5 7 9 11 13 15 17 19 21 23 25 27 29 31 33 35 Month - Select your answer Select your answer - Graph (i) Graph (ii) Graph (iii) Graph (iv) (b) Fit a linear trendline to the data. What does the trendline indicate about the price of gasoline over these 36 months? - Select your answer - - Select your answer - Positive non-linear trend Positive linear trend Negative linear trend Negative non-linear trend The following table contains time series data for regular gasoline prices in the United States for 36 consecutive months: Month Price ($) Month Price ($) Month Price ($) 2.27 13 2.84 25 3.91 2. 2.63 14 2.73 26 3.68 2.53 15 2.73 27 3.65 4 2.62 16 2.73 28 3.64 2.55 17 2.71 29 3.61 2.55 18 2.80 30 3.45 7 2.65 19 2.86 31 3.38 8 2.61 20 2.99 32 3.27 9. 2.72 21 3.10 33 3.38 10 2.64 22 3.21 34 3.58 11 2.77 23 3.56 35 3.85 12 2.85 24 3.80 36 3.90 (a) Choose the correct line chart for these time series data. What interpretations can you make about the average price per gallon of conventional regular gasoline over these 36 months? (i) Price ($) 4.50 4.00 3.50 3.00 2.50 2.00 1.50 1.00 0.50 1 3 5 7 9 11 13 15 17 19 21 23 25 27 29 31 33 35 Month (ii) Price ($) 4.50 4.00 3.50 ww 3.00 2.50 2.00 1.50 1.00 0.50 1 3 5 7 9 11 13 15 17 19 21 23 25 27 29 31 33 35 Month (iii) Price ($) 4.50 4.00 3.50 3.00 2.50 2.00 1.50 1.00 0.50 1 7 11 13 15 17 19 21 23 25 27 29 31 33 35 Month 3, (iv) Price ($) 4,50 4.00 3.50 3.00 2.50 2.00 1.50 1.00 0.50 1 3 5 7 9 11 13 15 17 19 21 23 25 27 29 31 33 35 Month - Select your answer Select your answer - Graph (i) Graph (ii) Graph (iii) Graph (iv) (b) Fit a linear trendline to the data. What does the trendline indicate about the price of gasoline over these 36 months? - Select your answer - - Select your answer - Positive non-linear trend Positive linear trend Negative linear trend Negative non-linear trend The following table contains time series data for regular gasoline prices in the United States for 36 consecutive months: Month Price ($) Month Price ($) Month Price ($) 2.27 13 2.84 25 3.91 2. 2.63 14 2.73 26 3.68 2.53 15 2.73 27 3.65 4 2.62 16 2.73 28 3.64 2.55 17 2.71 29 3.61 2.55 18 2.80 30 3.45 7 2.65 19 2.86 31 3.38 8 2.61 20 2.99 32 3.27 9. 2.72 21 3.10 33 3.38 10 2.64 22 3.21 34 3.58 11 2.77 23 3.56 35 3.85 12 2.85 24 3.80 36 3.90 (a) Choose the correct line chart for these time series data. What interpretations can you make about the average price per gallon of conventional regular gasoline over these 36 months? (i) Price ($) 4.50 4.00 3.50 3.00 2.50 2.00 1.50 1.00 0.50 1 3 5 7 9 11 13 15 17 19 21 23 25 27 29 31 33 35 Month (ii) Price ($) 4.50 4.00 3.50 ww 3.00 2.50 2.00 1.50 1.00 0.50 1 3 5 7 9 11 13 15 17 19 21 23 25 27 29 31 33 35 Month (iii) Price ($) 4.50 4.00 3.50 3.00 2.50 2.00 1.50 1.00 0.50 1 7 11 13 15 17 19 21 23 25 27 29 31 33 35 Month 3, (iv) Price ($) 4,50 4.00 3.50 3.00 2.50 2.00 1.50 1.00 0.50 1 3 5 7 9 11 13 15 17 19 21 23 25 27 29 31 33 35 Month - Select your answer Select your answer - Graph (i) Graph (ii) Graph (iii) Graph (iv) (b) Fit a linear trendline to the data. What does the trendline indicate about the price of gasoline over these 36 months? - Select your answer - - Select your answer - Positive non-linear trend Positive linear trend Negative linear trend Negative non-linear trend The following table contains time series data for regular gasoline prices in the United States for 36 consecutive months: Month Price ($) Month Price ($) Month Price ($) 2.27 13 2.84 25 3.91 2. 2.63 14 2.73 26 3.68 2.53 15 2.73 27 3.65 4 2.62 16 2.73 28 3.64 2.55 17 2.71 29 3.61 2.55 18 2.80 30 3.45 7 2.65 19 2.86 31 3.38 8 2.61 20 2.99 32 3.27 9. 2.72 21 3.10 33 3.38 10 2.64 22 3.21 34 3.58 11 2.77 23 3.56 35 3.85 12 2.85 24 3.80 36 3.90 (a) Choose the correct line chart for these time series data. What interpretations can you make about the average price per gallon of conventional regular gasoline over these 36 months? (i) Price ($) 4.50 4.00 3.50 3.00 2.50 2.00 1.50 1.00 0.50 1 3 5 7 9 11 13 15 17 19 21 23 25 27 29 31 33 35 Month (ii) Price ($) 4.50 4.00 3.50 ww 3.00 2.50 2.00 1.50 1.00 0.50 1 3 5 7 9 11 13 15 17 19 21 23 25 27 29 31 33 35 Month (iii) Price ($) 4.50 4.00 3.50 3.00 2.50 2.00 1.50 1.00 0.50 1 7 11 13 15 17 19 21 23 25 27 29 31 33 35 Month 3, (iv) Price ($) 4,50 4.00 3.50 3.00 2.50 2.00 1.50 1.00 0.50 1 3 5 7 9 11 13 15 17 19 21 23 25 27 29 31 33 35 Month - Select your answer Select your answer - Graph (i) Graph (ii) Graph (iii) Graph (iv) (b) Fit a linear trendline to the data. What does the trendline indicate about the price of gasoline over these 36 months? - Select your answer - - Select your answer - Positive non-linear trend Positive linear trend Negative linear trend Negative non-linear trend The following table contains time series data for regular gasoline prices in the United States for 36 consecutive months: Month Price ($) Month Price ($) Month Price ($) 2.27 13 2.84 25 3.91 2. 2.63 14 2.73 26 3.68 2.53 15 2.73 27 3.65 4 2.62 16 2.73 28 3.64 2.55 17 2.71 29 3.61 2.55 18 2.80 30 3.45 7 2.65 19 2.86 31 3.38 8 2.61 20 2.99 32 3.27 9. 2.72 21 3.10 33 3.38 10 2.64 22 3.21 34 3.58 11 2.77 23 3.56 35 3.85 12 2.85 24 3.80 36 3.90 (a) Choose the correct line chart for these time series data. What interpretations can you make about the average price per gallon of conventional regular gasoline over these 36 months? (i) Price ($) 4.50 4.00 3.50 3.00 2.50 2.00 1.50 1.00 0.50 1 3 5 7 9 11 13 15 17 19 21 23 25 27 29 31 33 35 Month (ii) Price ($) 4.50 4.00 3.50 ww 3.00 2.50 2.00 1.50 1.00 0.50 1 3 5 7 9 11 13 15 17 19 21 23 25 27 29 31 33 35 Month (iii) Price ($) 4.50 4.00 3.50 3.00 2.50 2.00 1.50 1.00 0.50 1 7 11 13 15 17 19 21 23 25 27 29 31 33 35 Month 3, (iv) Price ($) 4,50 4.00 3.50 3.00 2.50 2.00 1.50 1.00 0.50 1 3 5 7 9 11 13 15 17 19 21 23 25 27 29 31 33 35 Month - Select your answer Select your answer - Graph (i) Graph (ii) Graph (iii) Graph (iv) (b) Fit a linear trendline to the data. What does the trendline indicate about the price of gasoline over these 36 months? - Select your answer - - Select your answer - Positive non-linear trend Positive linear trend Negative linear trend Negative non-linear trend
Expert Answer:
Answer rating: 100% (QA)
Solution a The answer is Graph iv To construct a line chart in Excel follow the below steps 1 Choose ... View the full answer

Related Book For 

Essentials of Business Analytics
ISBN: 978-1285187273
1st edition
Authors: Jeffrey Camm, James Cochran, Michael Fry, Jeffrey Ohlmann , David Anderson, Dennis Sweeney, Thomas Williams
Posted Date:
Students also viewed these mathematics questions
-
The following table contains time series data for regular gasoline prices in the United States for 36 consecutive months: a. Create a line chart for these time series data. What interpretations can...
-
What conclusions can you make about credit terms from reviewing your answers to Problem 4?
-
What conclusions can you make about Purinas customers and brand based on these and the opening story?
-
In a bank reconciliation, deposits in transit are: (a) deducted from the book balance. (b) added to the book balance. (c) added to the bank balance. (d) deducted from the bank balance.
-
1. Which of the following is not subject to self-employment tax? a. Net earnings of the owner of a shoe store b. Net earnings of a self-employed lawyer c. Distributive share of earnings of a...
-
Tables 14.4.9 and 14.4.10 show basic computer results from a BoxJenkins analysis of yields on three-month U.S. Treasury bills each year from 1970 through 2009. a. What kind of process has been...
-
The data in Table B. 5 present the performance of a chemical process as a function of several controllable process variables. a. Fit a multiple regression model relating $\mathrm{CO}_{2}$ product...
-
Table 26 identifies the different life cycles of programs, projects, systems, and products. For each of the life cycles phases, select a project organizational form that you feel would work best....
-
A pickle producer currently purchases lids for its jars from a certain manufacturing company. The lids must have a diameter of approximately 3.5 inches, and because the lids must fit securely, the...
-
The bills of materials for two finished products (D and E), inventory status, and other relevant information are given below. Compute the planned order releases and projected on-hand balances for...
-
On 1 July 2022, Pine Ltd. acquired all the share capital of Island Ltd. for $250,000. At that date, Island Ltd.s equity consisted of the following: Share Capital 100,000 General Reserve 20,000...
-
Group performance does not depend on individual and collective efforts. True False
-
Which of these roles helps maintain participation and obligation to the group by the group members on an emotional level? Work roles Maintenance role Blocking role None of the above
-
Provide the definition of cost basis and adjusted basis and what is included to calculate basis.
-
Which of the following is a positive reaction to the barrier encountered in achieving a desired goal? Restructuring Withdrawal Fixation Regression
-
A cross-functional team comprises individuals with different functional proficiency. True False
-
From your understanding the text describe what operations management is and how this function contributes to the transformation process of the organization?
-
Marc Company assembles products from a group of interconnecting parts. The company produces some of the parts and buys some from outside vendors. The vendor for Part X has just increased its price by...
-
Grear Tire Company has produced a new tire with an estimated mean lifetime mileage of 36,500 miles. Management also believes that the standard deviation is 5000 miles and that tire mileage is...
-
Let us consider again the investment data from Hauck Financial Services used in Section 10.4 to illustrate the Markowitz portfolio model. The data follows, along with the return of the S&P 500 Index....
-
OuRx, a retail pharmacy chain, is faced with the decision of how much flu vaccine to order for the next flu season. OuRx has to place a single order for the flu vaccine several months before the...
-
Which of the following is a sale of goods and therefore is covered by Article 2 of the Uniform Commercial Code? A. Development, implementation, hosting, and operation of sophisticated computing...
-
Kemesia Boota Ward signed a contract on February 17, 2010, to hold her wedding reception at the Deauville Hotel on July 9, 2010. (The wedding ceremony was being held elsewhere.) Renting the ballroom...
-
December 2007. When she joined, she signed a membership agreement that had a release of liability that stated: 24 Hour. will not be liable for any injury, including, without limitation, personal,...

Study smarter with the SolutionInn App