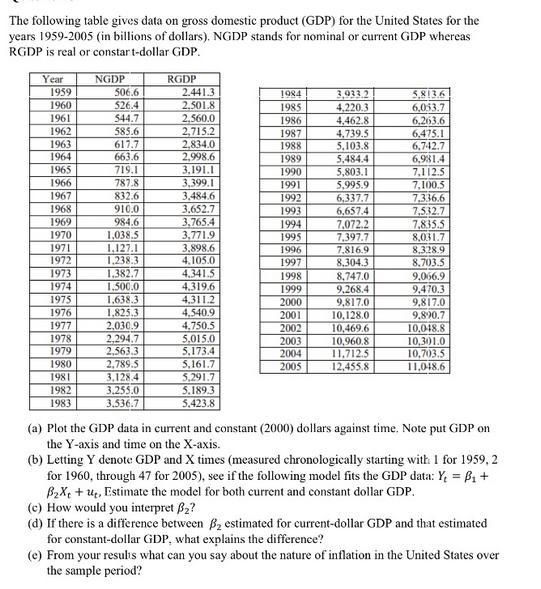
The following table gives data on gross domestic product (GDP) for the United States for the...
Fantastic news! We've Found the answer you've been seeking!
Question:
Transcribed Image Text:
The following table gives data on gross domestic product (GDP) for the United States for the years 1959-2005 (in billions of dollars). NGDP stands for nominal or current GDP whereas RGDP is real or constart-dollar GDP. Year 1959 1960 1961 1962 1963 1964 1965 1966 1967 1968 1969 1970 1971 1972 1973 1974 1975 1976 1977 1978 1979 1980 1981 1982 1983 NGDP 506.6 526.4 544.7 585.6 617.7 663.6 719.1 787.8 832.6 910.0 984.6 1.038.5 1.127.1 1,238.3 1,382.7 1,500.0 1,638.3 1,825.3 2,030.9 2,294.7 2,563.3 2,789.5 3,128.4 3.255.0 3.536.7 RGDP 2.441.3 2.501.8 2,560.0 2,715.2 2,834.0 2.998.6 3,191.1 3,399.1 3,484.6 3.652.7 3,765.4 3,771.9 3,898.6 4,105.0 4,341.5 4,319.6 4,311.2 4,540.9 4,750.5 5,015.0 5,173.4 5,161.7 5,291.7 5.189.3 5.423.8 1984 1985 1986 1987 1988 1989 1990 1991 1992 1993 1994 1995 1996 1997 1998 1999 2000 2001 2002 2003 2004 2005 3,933.2 4,220.3 4,462.8 4,739.5 5,103.8 5,484.4 5,803.1 5,995.9 6,337,7 6,657.4 7,072.2 7,397.7 7,816.9 8.304.3 8,747.0 9,268.4 9,817.0 10,128.0 10,469.6 10,960.8 11,712.5 12,455.8 5,813.6 6,053.7 6,263.6 6,475.1 6,742.7 6,9814 7,112.5 7,100.5 7.336.6 7,532.7 7.835.5 8,031.7 8,328.9 8.703.5 9,066.9 9,470.3 9,817.0 9,890.7 10,048.8 10,301.0 10,703.5 11,048.6 (a) Plot the GDP data in current and constant (2000) dollars against time. Note put GDP on the Y-axis and time on the X-axis. (b) Letting Y denote GDP and X times (measured chronologically starting with I for 1959, 2 for 1960, through 47 for 2005), see if the following model fits the GDP data: Y = B + BX +u, Estimate the model for both current and constant dollar GDP. (c) How would you interpret 3? (d) If there is a difference between B estimated for current-dollar GDP and that estimated for constant-dollar GDP, what explains the difference? (e) From your results what can you say about the nature of inflation in the United States over the sample period? The following table gives data on gross domestic product (GDP) for the United States for the years 1959-2005 (in billions of dollars). NGDP stands for nominal or current GDP whereas RGDP is real or constart-dollar GDP. Year 1959 1960 1961 1962 1963 1964 1965 1966 1967 1968 1969 1970 1971 1972 1973 1974 1975 1976 1977 1978 1979 1980 1981 1982 1983 NGDP 506.6 526.4 544.7 585.6 617.7 663.6 719.1 787.8 832.6 910.0 984.6 1.038.5 1.127.1 1,238.3 1,382.7 1,500.0 1,638.3 1,825.3 2,030.9 2,294.7 2,563.3 2,789.5 3,128.4 3.255.0 3.536.7 RGDP 2.441.3 2.501.8 2,560.0 2,715.2 2,834.0 2.998.6 3,191.1 3,399.1 3,484.6 3.652.7 3,765.4 3,771.9 3,898.6 4,105.0 4,341.5 4,319.6 4,311.2 4,540.9 4,750.5 5,015.0 5,173.4 5,161.7 5,291.7 5.189.3 5.423.8 1984 1985 1986 1987 1988 1989 1990 1991 1992 1993 1994 1995 1996 1997 1998 1999 2000 2001 2002 2003 2004 2005 3,933.2 4,220.3 4,462.8 4,739.5 5,103.8 5,484.4 5,803.1 5,995.9 6,337,7 6,657.4 7,072.2 7,397.7 7,816.9 8.304.3 8,747.0 9,268.4 9,817.0 10,128.0 10,469.6 10,960.8 11,712.5 12,455.8 5,813.6 6,053.7 6,263.6 6,475.1 6,742.7 6,9814 7,112.5 7,100.5 7.336.6 7,532.7 7.835.5 8,031.7 8,328.9 8.703.5 9,066.9 9,470.3 9,817.0 9,890.7 10,048.8 10,301.0 10,703.5 11,048.6 (a) Plot the GDP data in current and constant (2000) dollars against time. Note put GDP on the Y-axis and time on the X-axis. (b) Letting Y denote GDP and X times (measured chronologically starting with I for 1959, 2 for 1960, through 47 for 2005), see if the following model fits the GDP data: Y = B + BX +u, Estimate the model for both current and constant dollar GDP. (c) How would you interpret 3? (d) If there is a difference between B estimated for current-dollar GDP and that estimated for constant-dollar GDP, what explains the difference? (e) From your results what can you say about the nature of inflation in the United States over the sample period?
Expert Answer:
Answer rating: 100% (QA)
a To plot the GDP data in current and constant 2000 dollars against time we will create two separate line plots The xaxis will represent time measured chronologically and the yaxis will represent GDP ... View the full answer
Related Book For
Posted Date:
Students also viewed these economics questions
-
Discuss an opinion piece supporting that electric cars are not the future. The opinion piece should be presented in the form of a one-sided argument. This piece should be very well written-free of...
-
During your work placement, identify a work practice and related policy or procedure that you think could be improved to better meet legal requirements or responsibilities.
-
Associated Media Graphics (AMG) is a rapidly expanding company involved in the mass reproduction of instructional materials. Ralph Boston, owner and manager of AMG, has made a concentrated effort...
-
A light spring with a force constant of 13 N/m is connected to a wall and to a 1.2-kg toy bulldozer, as shown in FIGURE 6-68. When the electric motor in the bulldozer is turned on, it stretches the...
-
At the beginning of 2019, Metatec Inc. acquired Ellison Technology Corporation for $600 million. In addition to cash, receivables, and inventory, the following assets and their fair values were also...
-
P(-2.46 < z < 3.1) Find the indicated probability using the standard normal distribution. If convenient, use technology to find the probability.
-
John Ranton, president and founder of Running Mate, could hardly contain his excitement over the operating results for his company's second year of operations. Running Mate is an online retailer of a...
-
A narrow beam of light with wavelengths from 480 nm to 780 nm is incident perpendicular to one face of a prism made of crown glass, for which the index of refraction ranges from n = 1.541 to n =...
-
The cash receipts journal of Silver Plastics follows. Silver s general ledger includes the following selected accounts, along with their account numbers: Indicate whether each posting reference (a)...
-
13.175 The angle 0 = 4t + t rad, where t is time in seconds. Determine the angular velocity w of the line L relative to the line Lo at time t = 2 s, in rad/s and in revolutions per minute (rpm).
-
Tanner-UNF Corporation acquired as a long-term investment $160 million of 5% bonds, dated July 1, on July 1, 2018. Company management has the positive intent and ability to hold the bonds until...
-
Your favorite bank is offering to lend $10,000 to you with the agreement to make monthly payment of $250 over 4 years. What is the effective annual rate the bank is charging you? If you agree to...
-
Use this interface definition to solve this problem. 1 public interface QueueADT { 2 /* Set the queue to its initial state. */ public void clear(); AWN 3 4 5 /* Add an element to the queue (on rear)....
-
here are needs arising for organizations as they set their business strategy and establish their strategic goals. It is critical to align the projects selected with the strategies and goals...
-
Let f(x) = x 3x + 2 = (x 1)((x 1) - 3). Fill answers in the blank. (1) The domain of f is (2) The x-intercept is at x = (3) Horizontal asymptote(s) of fis and vertical asymptote(s) of f is (4) f'(x)...
-
This is a study on minimum wage and poverty thresholds. I have included the procedure for one year, 2009, below. You will calculate all variables for all years 1968 2013. You will have three graphs....
-
Sheldon and Leonard had a million-dollar idea. In order to make it happen, they have to do special research first. Only Kripke can help them in this matter. But Kripke is known to be the first-class...
-
Estimating the capital asset pricing model (CAPM). In Section 6.1 we considered briefly the well-known capital asset pricing model of modern portfolio theory. In empirical analysis, the CAPM is...
-
Suppose the true model is Y i = 1 + 2 X i + X 2i + 3 X 3i + u i But you estimate Y i = 1 + 2 X i + v i If you use observations of Y at X = 3, 2, 1, 0, 1, 2, 3, and estimate the incorrect model,...
-
From the scattergram given in Figure 2.9, what general conclusions do you draw? What is the economic theory that underlies this scattergram? 10 11 12 6. Scarce land; Abundant land; less skilled...
-
Home Inc. (a US company) has a wholly-owned subsidiary, S, which it acquired on 1 January X0. The balance sheets of S as at 1 January X0 and 31 December X0 are as set out in Figure 15.1 in foreign...
-
An entitys functional currency is: A. The currency of its parents country. B. The currency of its own country. C. The currency in which the financial statements are presented. D. The currency of the...
-
Entity X based in one country (currency $) bought goods from Entity Y in another country (currency :) for :300,000 on 1 May 20X1. The spot rate on that date was $1 = :1. As at 31 December 20X1, the...
Study smarter with the SolutionInn App